Inverted HammerCandlestick Pattern
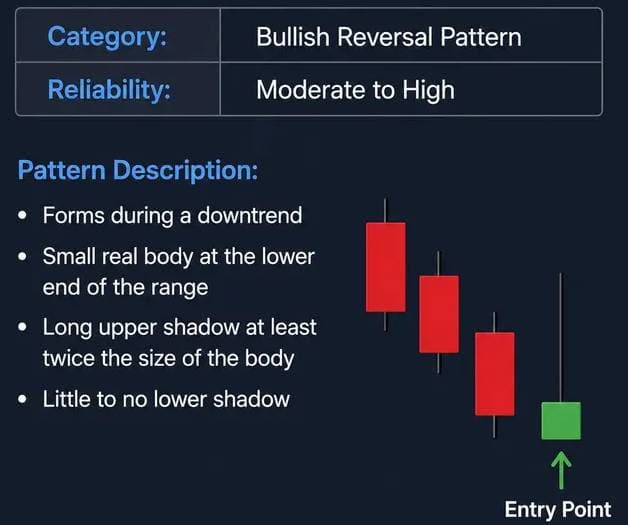
The Inverted Hammer is a bullish reversal candlestick pattern that typically forms after a sustained downtrend. It features a small real body near the lower end of the candle and a long upper shadow, indicating that buyers attempted to push prices higher even though sellers regained some control before the close.
Although the candle alone does not guarantee a reversal, it often signals that bearish momentum is weakening. When confirmed by the following candle, increasing volume, or additional technical indicators, the Inverted Hammer can provide an early indication that a bullish trend reversal may be developing.
Key Characteristics
The real body is positioned near the lower end of the candle, showing that price closed close to where it opened despite significant intraday buying pressure.
Small Body
The body is relatively small and can be either bullish (green) or bearish (red), located at the lower end of the trading range.
Long Upper Wick
The upper shadow should ideally be at least twice the size of the real body, demonstrating that buyers were able to drive prices substantially higher during the trading session.
Downtrend Location
The Inverted Hammer is most meaningful when it appears after an established downtrend, where sellers have been controlling the market before momentum begins to shift.
What is the Inverted Hammer?
The Inverted Hammer is a single-candle bullish reversal pattern that appears near the bottom of a downtrend. While sellers initially remain in control, buyers step in aggressively during the session and push price significantly higher. Although the candle closes back near its opening price, the long upper wick reveals increasing buying interest.
Unlike continuation patterns, the Inverted Hammer does not confirm a reversal by itself. Instead, it serves as an early warning that selling pressure may be fading. Traders typically wait for the next candle to close above the Inverted Hammer's high or look for confirmation using indicators such as RSI, MACD, or volume before entering a long position.
The pattern is commonly observed across stocks, forex, cryptocurrencies, commodities, and indices on both intraday and higher timeframes.
Key Insight
The Inverted Hammer reflects a shift in market psychology. Although sellers remain active, buyers demonstrate enough strength to reject lower prices. This transition often marks the beginning of a potential trend reversal when confirmed by subsequent price action.
How to Identify the Pattern
Structure of the Inverted Hammer
Existing Downtrend
The pattern should appear after a clear bearish trend or a meaningful price correction. Without a preceding downtrend, the candle loses much of its reversal significance.
Formation of the Candlestick
Look for a small real body positioned near the candle's low with a long upper shadow. The upper wick should be at least twice the size of the real body, while the lower shadow should be very small or absent.
Volume Consideration
Higher volume during formation increases the pattern's significance and reliability.
Confirmation Candle
Wait for the next candle to close above the high of the Inverted Hammer or produce a strong bullish breakout. Confirmation helps reduce the likelihood of false reversal signals.
Types of Inverted Hammers
Regular Inverted Hammer
Appears in a downtrend and signals a potential bullish reversal. The pattern you're learning about.
Shooting Star
Similar in appearance but occurs after an uptrend, indicating a potential bearish reversal.
Trading Strategy
Entry Strategy
Wait for Confirmation: The Inverted Hammer is a single-candle bullish reversal pattern that appears near the bottom of a downtrend. While sellers initially remain in control, buyers step in aggressively during the session and push price significantly higher. Although the candle closes back near its opening price, the long upper wick reveals increasing buying interest.
Setting Stop Loss
Stop Loss Placement: A stop loss is commonly placed below the low of the Inverted Hammer candle to manage trading risk.
Determining Target Price
Target Calculation: Traders can measure the total size of the candle and project the same distance upward from the breakout level to estimate a target price.
Example Calculation
If the Inverted Hammer has:
- High:
$60 - Low:
$50 - Close:
$55
Distance = $60 - $50 = $10
Target = $60 (breakout) + $10 = $70
Risk Management
Risk-Reward Ratio
Risk management is very important while trading candlestick patterns. Many traders prefer using a minimum risk-reward ratio of 1:2. This means the possible reward should be at least double the amount being risked on the trade.
Position Sizing
Traders should always choose a position size based on their account balance and risk tolerance. Proper position sizing helps protect trading capital and reduces the impact of losing trades.
Tips for Successful Trading
Use Additional Indicators
Incorporate RSI or MACD to confirm bullish momentum and enhance your trading decisions.
Assess Market Context
The Inverted Hammer is more effective in bullish market environments. Consider broader trends.
Be Patient
Wait for confirmation of the bullish reversal before entering. Avoid rushing into trades.
Conclusion
The Inverted Hammer candlestick pattern is a valuable tool for traders looking to identify potential bullish reversals after a downtrend. By following a systematic approach to identifying the pattern, managing risk effectively, and confirming with volume and other indicators, you can enhance your trading strategy and increase your chances of success.
Happy trading!
Frequently Asked Questions
Why does the inverted hammer signal a bullish reversal when the wick is on top?
The long upper wick shows buyers tried to push price higher during the candle, but sellers pushed it back down by the close. After a downtrend, that rejection of lower prices often means selling pressure is fading. The small body near the low suggests buyers are stepping in—hence the bullish reversal potential.
Should I wait for the next candle after an inverted hammer?
Yes. Waiting for the next candle to close above the inverted hammer’s body (or high) confirms that buyers are in control. Entering on the inverted hammer candle alone is riskier because price can still fall. Confirmation improves your win rate and helps avoid false signals.
Can the inverted hammer appear in an uptrend?
It can appear anywhere, but its meaning changes with context. After a downtrend it’s a bullish reversal signal. After an uptrend, a candle with a long upper wick and small body is often called a shooting star and can signal a bearish reversal. Always look at the trend before the candle.
How is the inverted hammer different from a shooting star?
They look identical—small body at the bottom, long upper wick. The difference is context: inverted hammer forms after a downtrend (bullish signal); shooting star forms after an uptrend (bearish signal). The same shape, opposite trend, opposite interpretation.
Where do I put my stop loss when trading an inverted hammer?
Place your stop loss just below the low of the inverted hammer (the bottom of the body or wick). If price breaks below that level, the reversal setup is invalidated. Some traders use a stop below the recent swing low for extra room.