MACD Indicator
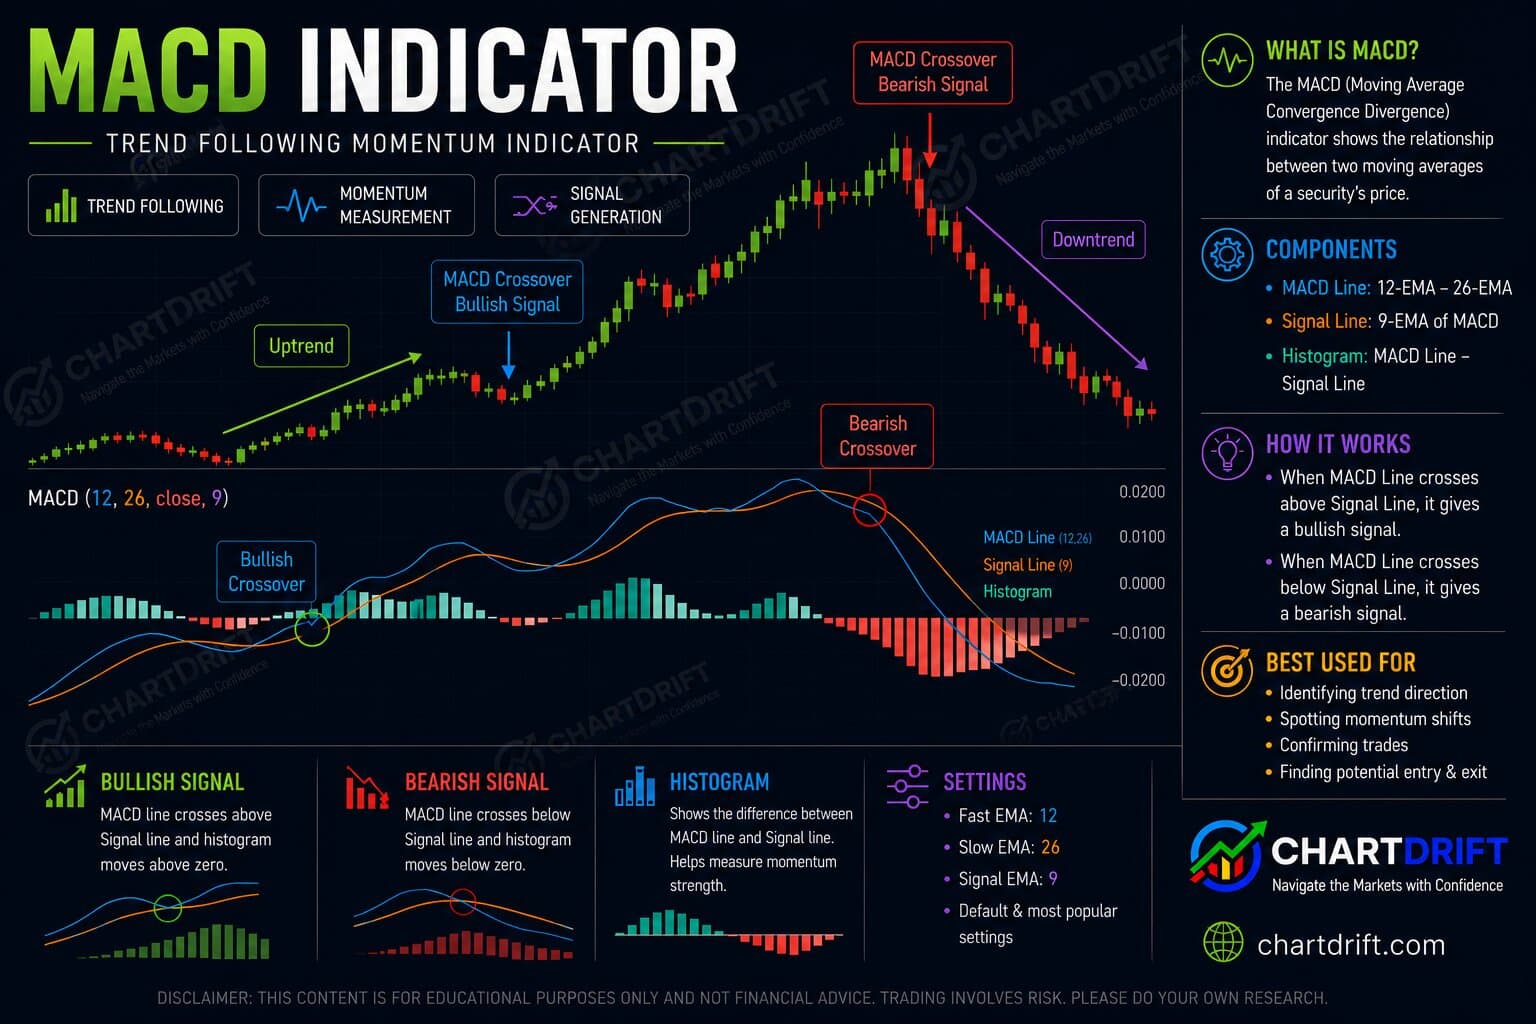
The MACD Indicator is a popular momentum and trend-following tool used in technical analysis to identify trend direction, momentum strength, and potential buy or sell signals. Traders widely use MACD in stocks, forex, and crypto markets to spot trend reversals and confirm market momentum with better accuracy.
What is the MACD Indicator?
The MACD Indicator, short for Moving Average Convergence Divergence, is a technical analysis tool designed to measure market momentum and trend strength. It was developed to help traders understand whether bullish or bearish momentum is increasing or weakening over time. points.
MACD works by comparing two moving averages of price action, allowing traders to identify changes in trend direction and possible entry or exit opportunities. Because of its simplicity and effectiveness, MACD is considered one of the most trusted indicators among beginner and professional traders.
The indicator mainly consists of four components:
MACD Line
12-period EMA minus 26-period EMA. Shows momentum direction and strength.
Signal Line
9-period EMA of MACD line. Crossovers generate trading signals.
Histogram
Visual difference between MACD and Signal line. Shows momentum acceleration.
Zero Line
Center reference point. Crossovers indicate trend direction changes.
Understanding the MACD
The MACD was developed by Gerald Appel in the late 1970s and has become one of the most popular technical indicators among traders. It reveals changes in strength, direction, momentum, and duration of a trend.
Unlike simple moving averages, the MACD uses exponential moving averages (EMAs) which give more weight to recent prices. This makes it more responsive to current price action while still providing reliable trend information.
MACD Calculation
MACD Line = 12-period EMA − 26-period EMA
Signal Line = 9-period EMA of MACD Line
Histogram = MACD Line − Signal Line
Trading Signals
Bullish Signal Line Crossover
When the MACD line moves above the signal line, it usually indicates that bullish momentum is building in the market. Traders often see this as a potential buy signal, especially if the crossover happens below the zero line, as it may signal the start of a new upward trend.
Bearish Signal Line Crossover
When the MACD line falls below the signal line, it usually signals that bearish momentum is starting to increase. Traders often treat this as a potential sell signal, especially when the crossover happens above the zero line, as it may indicate the beginning of a downward move.
Zero Line Crossover
When the MACD moves above the zero line, it generally confirms that bullish momentum is strengthening and the market may be entering an uptrend. If the MACD drops below the zero line, it signals growing bearish momentum and a possible downtrend. These signals usually appear later than signal line crossovers, but traders often consider them more reliable for confirming trend direction.
Histogram Momentum
The MACD histogram helps traders understand how strong the current market momentum is. When the histogram bars continue to grow larger, it usually shows that the trend is becoming stronger and momentum is building. As the bars start getting smaller, it often signals that momentum is weakening, which can be an early warning of a possible trend slowdown or upcoming reversal.
MACD Divergence
Divergence occurs when price moves in the opposite direction of the MACD indicator. This powerful signal often precedes significant trend reversals.
Bullish Divergence
A bullish divergence happens when the price continues making lower lows, but the MACD starts forming higher lows. This usually indicates that selling pressure is fading and bearish momentum is weakening. Traders often view this signal as an early sign that the market could reverse and move upward.
Bearish Divergence
A bearish divergence occurs when the price keeps making higher highs, but the MACD forms lower highs. This usually suggests that bullish momentum is weakening even though the price is still rising. Traders often consider it an early warning sign that the uptrend may lose strength and a downward reversal could happen soon.
Best Practices
Use Multiple Timeframes
Confirm signals on higher timeframes before trading on lower ones. A bullish crossover on the daily chart adds weight to a 4-hour signal.
Combine with Price Action
Look for MACD signals at key support/resistance levels. A bullish crossover at major support is more significant than one in the middle of a range.
Beware of False Signals
MACD can produce whipsaws in ranging markets. Wait for histogram confirmation or use additional filters like volume or other indicators.
Optimal Settings
While the default 12, 26, 9 settings work well for most markets, you can adjust them based on your trading style and the asset you're analyzing.
| Trading Style | Fast EMA | Slow EMA | Signal | Use Case |
|---|---|---|---|---|
| Standard | 12 | 26 | 9 | Most markets, swing trading |
| Fast | 5 | 13 | 1 | Day trading, scalping |
| Slow | 19 | 39 | 9 | Position trading, less noise |
Frequently Asked Questions
What is MACD and how does it work?
MACD (Moving Average Convergence Divergence) is a momentum indicator that shows the relationship between two moving averages of price. It consists of a MACD line (fast EMA minus slow EMA), a signal line (EMA of the MACD line), and a histogram. Crossovers and divergence help identify trend changes and momentum.
What do MACD crossovers mean?
When the MACD line crosses above the signal line, it generates a bullish signal; when it crosses below, a bearish signal. Zero-line crossovers indicate a shift in the short-term average relative to the long-term average and can confirm trend direction.
What are the best MACD settings?
The default 12, 26, 9 (fast, slow, signal) works well for daily charts. For faster signals use 5, 13, 1; for smoother, less noise use 19, 39, 9. Choose based on your timeframe and trading style.
What is MACD divergence?
Bullish divergence: price makes a lower low while MACD makes a higher low, suggesting weakening downtrend. Bearish divergence: price makes a higher high while MACD makes a lower high, suggesting weakening uptrend. Divergence often precedes reversals but should be confirmed with price action.
Can MACD be used for all timeframes?
Yes. MACD works on intraday, daily, and weekly charts. Shorter timeframes produce more signals and noise; longer timeframes give fewer but often stronger signals. Many traders use MACD on higher timeframes to confirm trend and on lower timeframes for entries.