Trading Indicators
Trading indicators help traders analyze market behavior, identify trends, measure momentum, and make more informed trading decisions. Whether you're trading stocks, forex, cryptocurrencies, commodities, or indices, technical indicators provide valuable insights into price action, volatility, and market sentiment.
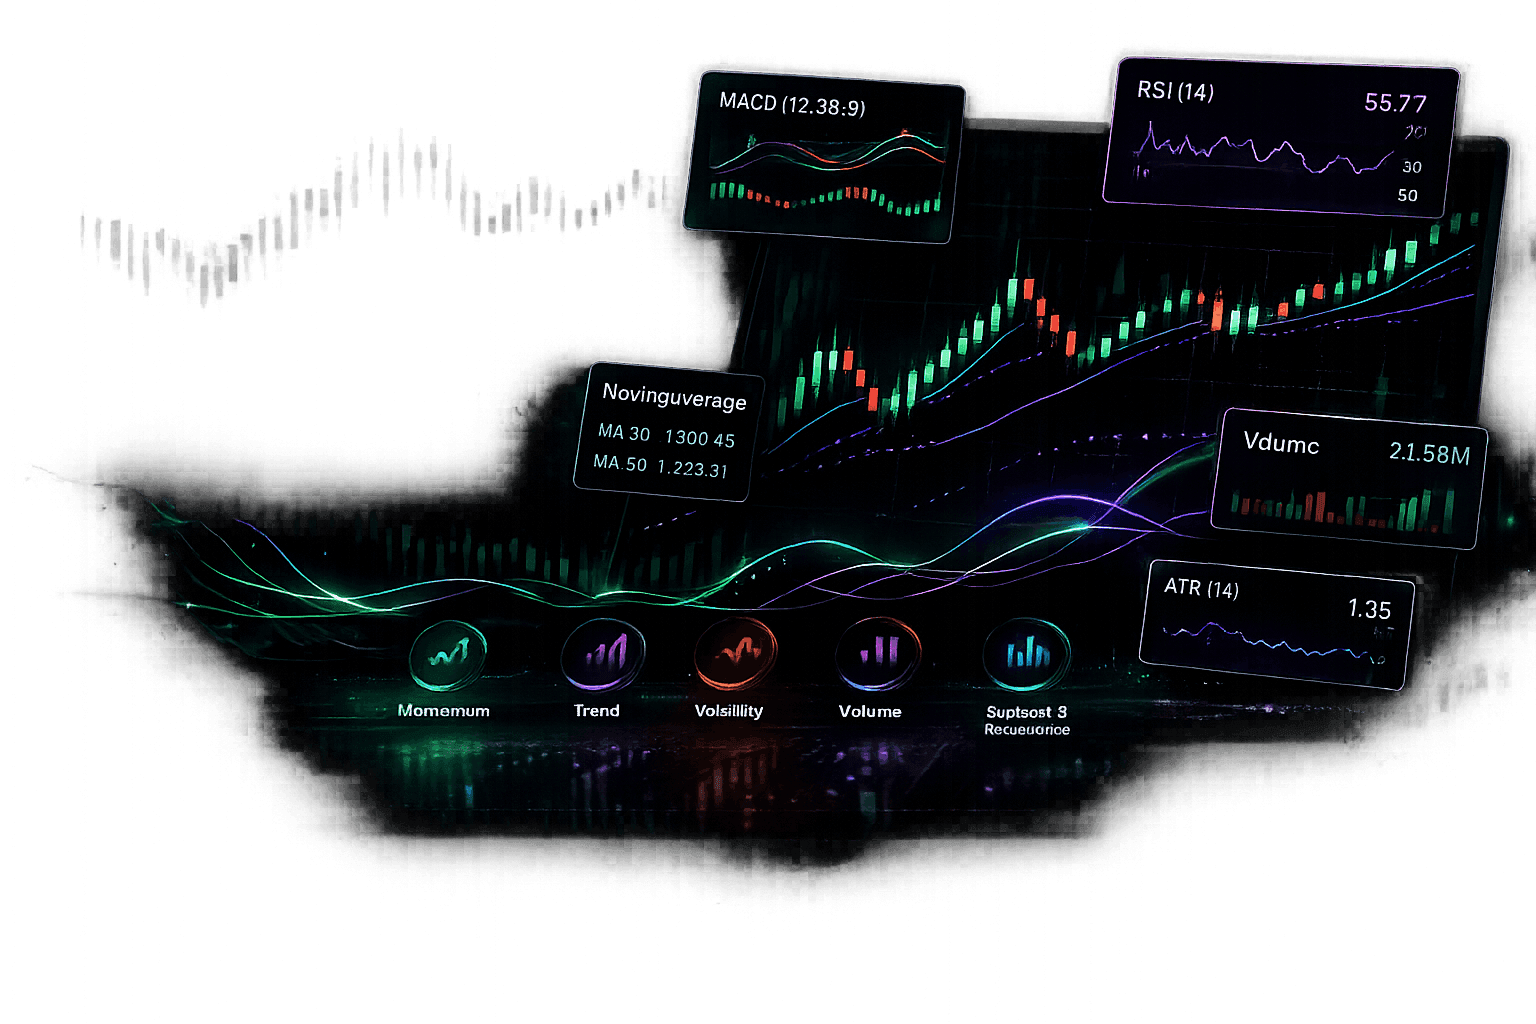
This collection includes the most widely used trading indicators, organized by category. From beginner-friendly tools like Moving Averages and RSI to advanced indicators such as VWAP, ADX, and Volume Profile, you'll find detailed guides covering formulas, interpretation, trading strategies, advantages, limitations, and practical examples.
Momentum IndicatorsMeasure the Strength of Price Movement
Momentum indicators evaluate how quickly price is moving and whether buying or selling pressure is increasing or decreasing. They are commonly used to identify overbought and oversold conditions, detect momentum shifts, and anticipate possible reversals.
MACD
Moving Average Convergence Divergence - identify trend changes and momentum shifts
RSI
Relative Strength Index - measure overbought and oversold conditions
Williams %R
Williams Percent Range - spot overbought, oversold, and momentum shifts
Stochastic
Compare closing price to price range over time for momentum signals
Trend IndicatorsIdentify the Direction of the Market
Trend indicators smooth price data to reveal the underlying market direction. Instead of focusing on short-term fluctuations, they help traders determine whether the market is trending upward, downward, or moving sideways.
These indicators are especially useful for trend-following strategies and filtering lower-probability trades.
Moving Averages
SMA, EMA, and WMA - smooth price data to identify trend direction
Bollinger Bands
Volatility bands that adapt to market conditions
ADX
Average Directional Index - measure trend strength without direction
Ichimoku Cloud
Complete trading system with support, resistance, momentum, and trend in one view
Parabolic SAR
Stop and Reverse indicator - trailing stops and trend reversals
Volume IndicatorsUnderstand Buying and Selling Pressure
Volume indicators analyze trading activity rather than price alone. Rising volume often confirms strong market participation, while declining volume may indicate weakening momentum or reduced conviction.
Combining price action with volume analysis can significantly improve trade confirmation.
Volatility IndicatorsMeasure Market Volatility
Volatility indicators help traders estimate how much price is likely to move over a given period. They are commonly used for setting stop-loss levels, managing position size, and identifying breakout opportunities.
Understanding volatility allows traders to adjust their strategy to changing market conditions.
Support and Resistance ToolsIdentify High-Probability Price Levels
Support and resistance indicators help locate areas where price may reverse, pause, or accelerate. These tools are widely used for planning entries, exits, stop-loss placement, and profit targets.
Rather than predicting exact turning points, they highlight areas where market participants may become active.
What Are Trading Indicators?
Technical indicators are mathematical calculations based on price, volume, or open interest that help traders analyze market conditions. Rather than predicting the future, indicators provide objective data that supports trading decisions by revealing trends, momentum, volatility, and buying or selling pressure.
Professional traders rarely rely on a single indicator. Instead, they combine multiple tools to confirm signals, reduce false entries, and build higher-probability trading strategies. Understanding when and how to use each indicator is just as important as knowing what it measures.
Why Use Technical Indicators?
Technical indicators help traders answer important market questions:
- Is the market trending or ranging?
- Are buyers or sellers in control?
- Is momentum increasing or weakening?
- Is volatility expanding or contracting?
- Where could potential support or resistance develop?
- Is the current trend losing strength?
Used correctly, indicators improve consistency by replacing emotional decisions with structured analysis.
How to Choose the Right Indicator
There is no single "best" trading indicator. The right choice depends on your strategy, trading style, and market conditions.
For example:
- Momentum traders often prefer RSI, MACD, and Williams %R.
- Day traders frequently use VWAP and Volume Profile.
- Swing traders combine ATR with Bollinger Bands and Moving Averages.
Instead of searching for a perfect indicator, focus on understanding what each tool measures and how different indicators complement one another.
Frequently Asked Questions
What are trading indicators?
Trading indicators are mathematical tools that analyze historical price and volume data to help traders identify trends, momentum, volatility, and potential trading opportunities.
Which indicator is best for beginners?
Many beginners start with Moving Averages, RSI, and MACD because they are easy to understand and widely used across different markets.
Can technical indicators predict the market?
No. Indicators cannot predict future price movements. They provide statistical insights that help traders make more informed decisions.
Do trading indicators work in all markets?
Yes. Technical indicators are commonly used in stocks, forex, cryptocurrencies, commodities, and indices, but they should always be interpreted with market context and risk management.
Should I use multiple indicators?
Yes, but avoid using several indicators that measure the same thing. A combination of trend, momentum, and volume indicators usually provides better confirmation.
Which indicator works best for intraday trading?
VWAP, Moving Averages, RSI, MACD, and Volume Profile are commonly used by intraday traders because they provide timely information about trend and momentum.
Do professional traders use indicators?
Yes. Many professional traders use indicators as confirmation tools alongside price action, market structure, volume, and risk management rather than relying on them alone.