Moving Averages
Moving Averages are among the most widely used indicators in technical analysis for identifying market trends and smoothing price fluctuations. They help traders understand the overall direction of the market, spot trend reversals, and find potential support or resistance levels across stocks, forex, and crypto trading.
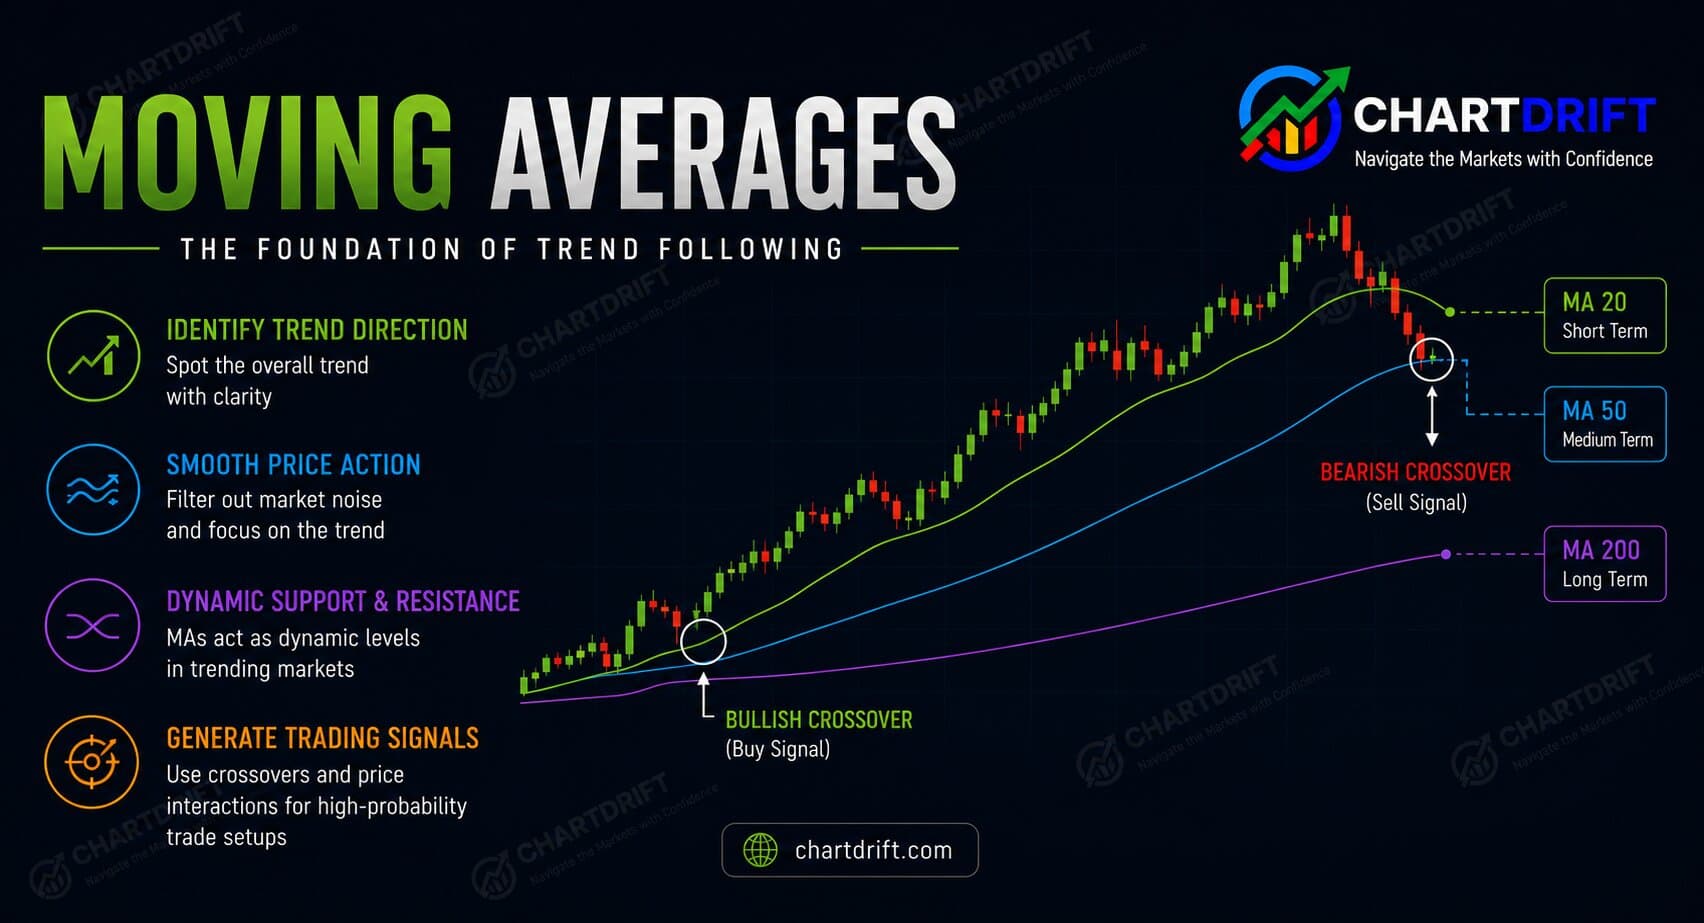
What are Moving Averages?
Moving Averages are technical indicators that calculate the average price of an asset over a selected time period. They help traders smooth out short-term price fluctuations and understand the overall market trend more clearly.
Instead of reacting to every small market movement, Moving Averages help traders focus on the bigger price direction. They are commonly used to identify trends, dynamic support and resistance levels, and potential trend reversal signals.
Types of Moving Averages
Simple Moving Average (SMA)
The Simple Moving Average calculates the average price over a selected period, giving equal importance to all prices. It reacts slowly to price changes and is commonly used to identify long-term trends.
Exponential Moving Average (EMA)
The Exponential Moving Average gives more importance to recent prices, making it faster and more responsive to market movements. Traders often use EMA for short-term trend analysis and quicker trading signals.
Weighted Moving Average (WMA)
The Weighted Moving Average assigns higher weight to recent price data while still considering older prices. It responds faster than SMA but is generally smoother than EMA.
SMA vs EMA: Which to Use?
| Aspect | SMA | EMA |
|---|---|---|
| Responsiveness | Slower, more lag | Faster, less lag |
| False Signals | Fewer whipsaws | More whipsaws |
| Best For | Long-term trends | Short-term trading |
| Popular Uses | 50, 100, 200 SMA | 9, 12, 26 EMA |
Crossover Signals
When a faster MA crosses a slower MA, it signals a potential trend change. These crossovers are among the most watched signals in technical analysis.
Golden Cross
The 50-day MA crosses above the 200-day MA. This bullish signal suggests a major trend reversal to the upside.
- • Major bullish signal
- • Often marks start of bull markets
- • Wait for confirmation close above both MAs
Death Cross
The 50-day MA crosses below the 200-day MA. This bearish signal suggests a potential major downturn ahead.
- • Major bearish signal
- • Often precedes bear markets
- • Exit longs, consider hedging
Popular Crossover Combinations
Dynamic Support & Resistance
Moving averages often act as dynamic support in uptrends and resistance in downtrends. Traders watch for price to "bounce" off key MAs.
MA as Support
In uptrends, price often pulls back to the MA before continuing higher. This creates buying opportunities.
- • Wait for price to touch the MA
- • Look for bullish candlestick patterns
- • Set stop below the MA
MA as Resistance
In downtrends, price often rallies to the MA before continuing lower. This creates shorting opportunities.
- • Wait for price to touch the MA
- • Look for bearish candlestick patterns
- • Set stop above the MA
Key MAs to watch: The 20, 50, 100, and 200-period MAs are most widely followed and therefore most likely to act as S/R levels.
Popular MA Settings
| Period | Type | Use Case |
|---|---|---|
| 9 EMA | EMA | Short-term trend, scalping |
| 20 SMA/EMA | Both | Short-term trend, day trading |
| 50 SMA | SMA | Medium-term trend, swing trading |
| 100 SMA | SMA | Medium-long term trend |
| 200 SMA | SMA | Long-term trend, institutional level |
MA Ribbon Strategy
Plot multiple MAs (like 8, 13, 21, 34, 55 EMAs) to create a "ribbon". When ribbons expand and align in one direction, the trend is strong. When they contract and tangle, expect consolidation.
Frequently Asked Questions
What is a moving average?
A moving average (MA) smooths price data by averaging prices over a set number of periods. It helps identify trend direction and dynamic support/resistance. Common types are SMA (simple) and EMA (exponential); EMA gives more weight to recent prices.
What is the difference between SMA and EMA?
SMA gives equal weight to all prices in the period; EMA gives more weight to recent prices and reacts faster to new data. EMAs are often used for short-term signals; SMAs (e.g. 200-day) are widely used for long-term trend context.
What do moving average crossovers mean?
A golden cross occurs when a faster MA crosses above a slower MA (e.g. 50 above 200), often interpreted as bullish. A death cross is when the faster MA crosses below the slower MA, often interpreted as bearish. Lag means crossovers confirm rather than lead.
Which moving average periods are most used?
Common choices: 9/21 for short-term, 50 for medium-term, 200 for long-term trend. Day traders use 8, 20, 50 EMAs; swing traders often use 20, 50, 200. Choose based on your timeframe and style.
Can moving averages be used as support and resistance?
Yes. In uptrends, price often bounces off MAs (e.g. 20 or 50 EMA) as dynamic support; in downtrends they can act as resistance. The 200-day MA is widely watched as a major trend and support/resistance level.