Ichimoku Cloud
The Ichimoku Cloud is an advanced trading indicator that helps traders analyze trend direction, momentum, and important support or resistance zones directly on the chart. It combines multiple signals into one system, making it useful for identifying high-probability trading setups in stocks, forex, and crypto markets.
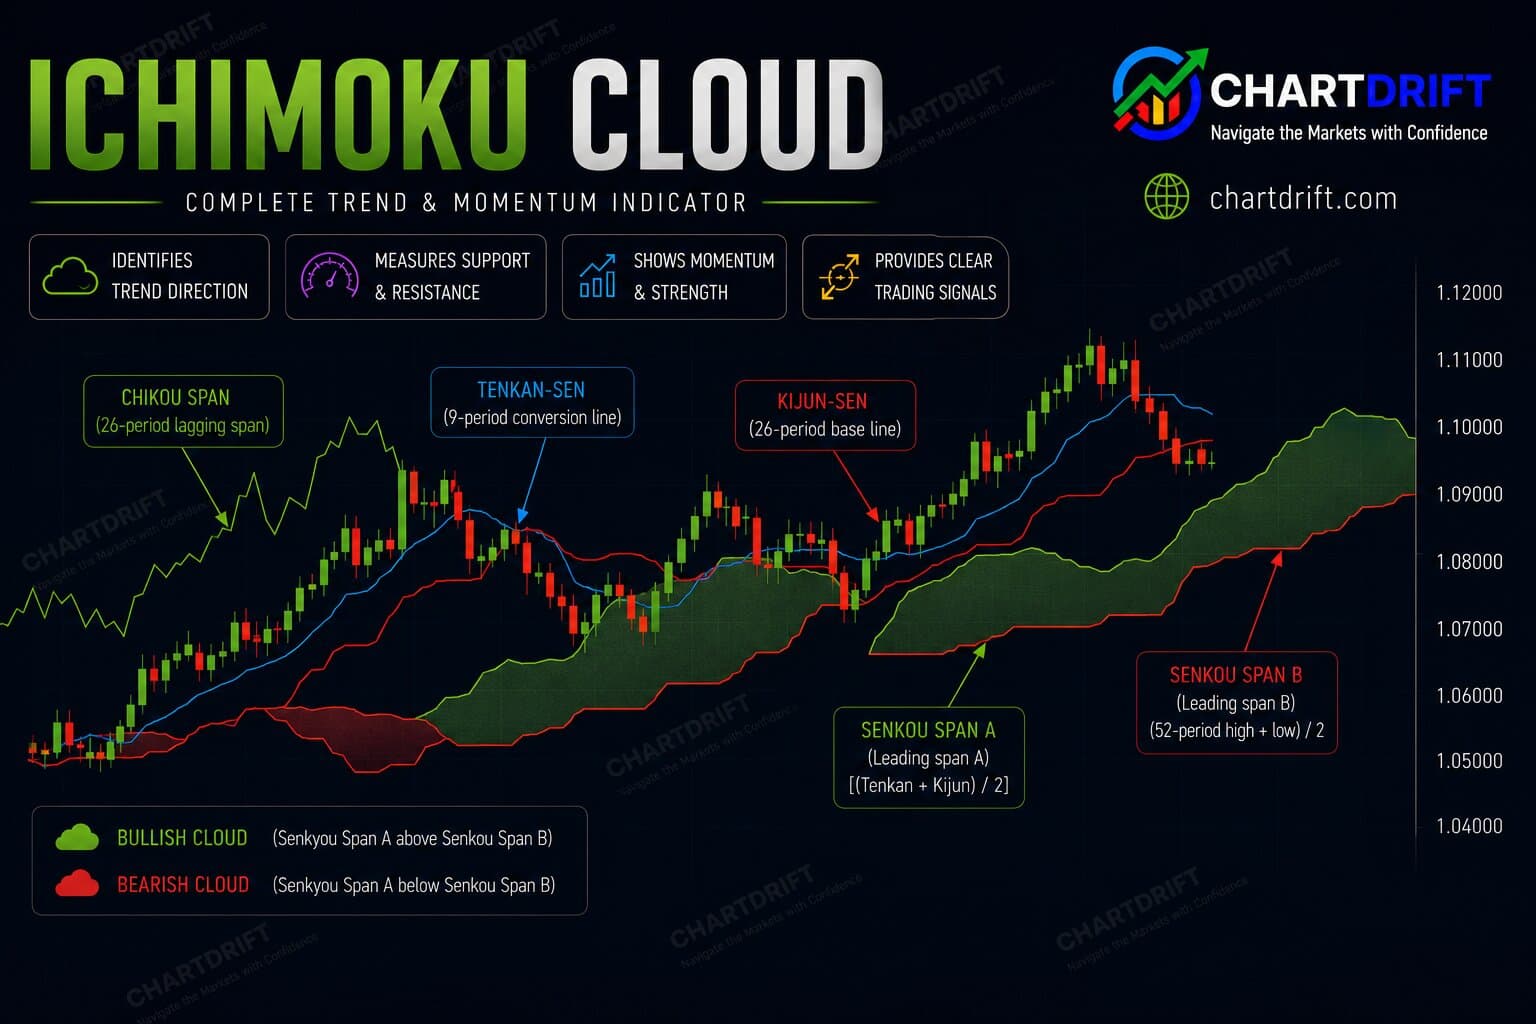
What is the Ichimoku Cloud?
The Ichimoku Cloud is a Japanese technical analysis indicator designed to give traders a complete view of the market in a single glance. It was created to help identify trends, momentum strength, future support and resistance areas, and possible entry or exit points.
Unlike basic indicators that provide only one type of signal, the Ichimoku Cloud combines several calculations together to create a broader market perspective. The indicator consists of five main components that work together to confirm trend direction and trading opportunities.
The most important part of the indicator is the “Cloud,” also known as the Kumo. When the price trades above the cloud, it usually signals a bullish trend. When the price stays below the cloud, it indicates bearish market conditions. If the price moves inside the cloud, the market is often considered sideways or uncertain.
Traders commonly use the Ichimoku Cloud to:
- Identify bullish and bearish trends
- Detect momentum strength
- Find dynamic support and resistance levels
- Confirm breakout opportunities
- Spot potential trend reversals
Because of its ability to combine trend analysis and momentum into one indicator, the Ichimoku Cloud is widely used by beginners and professional traders across different financial markets.
The Five Lines
Tenkan-sen (Conversion Line)
The average of the highest high and lowest low over the past 9 periods. Acts as a fast-moving support/resistance level and signals short-term momentum.
Kijun-sen (Base Line)
The average of the highest high and lowest low over the past 26 periods. Acts as a slower support/resistance and confirms trend direction.
Senkou Span A (Leading Span A)
The average of Tenkan-sen and Kijun-sen, plotted 26 periods ahead. Forms one edge of the Kumo cloud.
Senkou Span B (Leading Span B)
The average of the highest high and lowest low over the past 52 periods, plotted 26 periods ahead. Forms the other edge of the Kumo cloud.
Chikou Span (Lagging Span)
The current closing price plotted 26 periods back. Confirms trend momentum by comparing current price to past price action.
The Kumo Cloud
The Kumo (cloud) is the space between Senkou Span A and Senkou Span B. It's the most distinctive feature of the Ichimoku system and provides crucial support/resistance zones.
When Senkou Span A is above Senkou Span B, the cloud is bullish (typically green). Price above a bullish cloud confirms an uptrend.
When Senkou Span B is above Senkou Span A, the cloud is bearish (typically red). Price below a bearish cloud confirms a downtrend.
Cloud Thickness: A thick cloud indicates strong support/resistance, making breakouts more significant. Thin clouds are easier to break through but provide weaker confirmation.
Trading Signals
Bullish Signals
- • Price breaks above the Kumo cloud
- • Tenkan-sen crosses above Kijun-sen
- • Chikou Span is above price from 26 periods ago
- • Future cloud is bullish (Span A > Span B)
Bearish Signals
- • Price breaks below the Kumo cloud
- • Tenkan-sen crosses below Kijun-sen
- • Chikou Span is below price from 26 periods ago
- • Future cloud is bearish (Span B > Span A)
TK Cross Strategy
The TK Cross (Tenkan-Kijun cross) is one of the most popular Ichimoku trading strategies. Signal strength depends on where the cross occurs relative to the cloud.
Strong Bullish Signal
TK cross above the cloud. All elements align for maximum conviction. Consider full position size with stops below the Kijun-sen.
Neutral Signal
TK cross inside the cloud. The market is in a transition zone. Wait for confirmation or use reduced position sizes.
Weak Bullish Signal
TK cross below the cloud. Counter-trend signal with higher risk. Best avoided or used only for quick scalps with tight stops.
Pro Tips
Use Multiple Timeframes
Check the higher timeframe cloud for overall trend direction, then use the lower timeframe for precise entries in that direction.
Watch Cloud Twists
When the future cloud changes color (Span A and Span B cross), it signals a potential trend change ahead. Use this as an early warning.
Kijun-sen as Dynamic Stop
Trail your stop loss at the Kijun-sen level. It acts as a natural support/resistance and keeps you in trends while protecting profits.
Frequently Asked Questions
What is the Ichimoku Cloud?
The Ichimoku Cloud (Ichimoku Kinko Hyo) is a comprehensive indicator that shows trend, momentum, and support/resistance in one view. It consists of five lines and a shaded cloud (Kumo) that together provide entry, exit, and trend context.
What are the five lines in Ichimoku?
Tenkan-sen (conversion line), Kijun-sen (base line), Senkou Span A (leading span A), Senkou Span B (leading span B), and Chikou Span (lagging span). The space between Span A and Span B forms the Kumo (cloud).
How do I use the Kumo cloud?
Price above the cloud suggests an uptrend; below the cloud, a downtrend. The cloud acts as dynamic support/resistance. Thick cloud is stronger support/resistance; thin cloud is easier to break. Cloud color (green/red) indicates bullish/bearish bias.
What is the TK cross?
The TK cross is when Tenkan-sen crosses Kijun-sen. A bullish cross (Tenkan above Kijun) can signal a buy, especially above the cloud; a bearish cross can signal a sell, especially below the cloud. Use with cloud and Chikou for confirmation.
Can Ichimoku be used on all timeframes?
Yes. Default settings (9, 26, 52) suit daily charts. Use the same logic on higher timeframes for trend and on lower timeframes for entries. Multiple timeframe analysis—trend on higher, entry on lower—works well with Ichimoku.