On-Balance Volume (OBV)
The On Balance Volume (OBV) Indicator is a volume-based technical analysis tool that helps traders measure buying and selling pressure in the market. By combining price movement with trading volume, OBV helps identify trend strength, confirm breakouts, and spot potential reversals before major price moves happen.
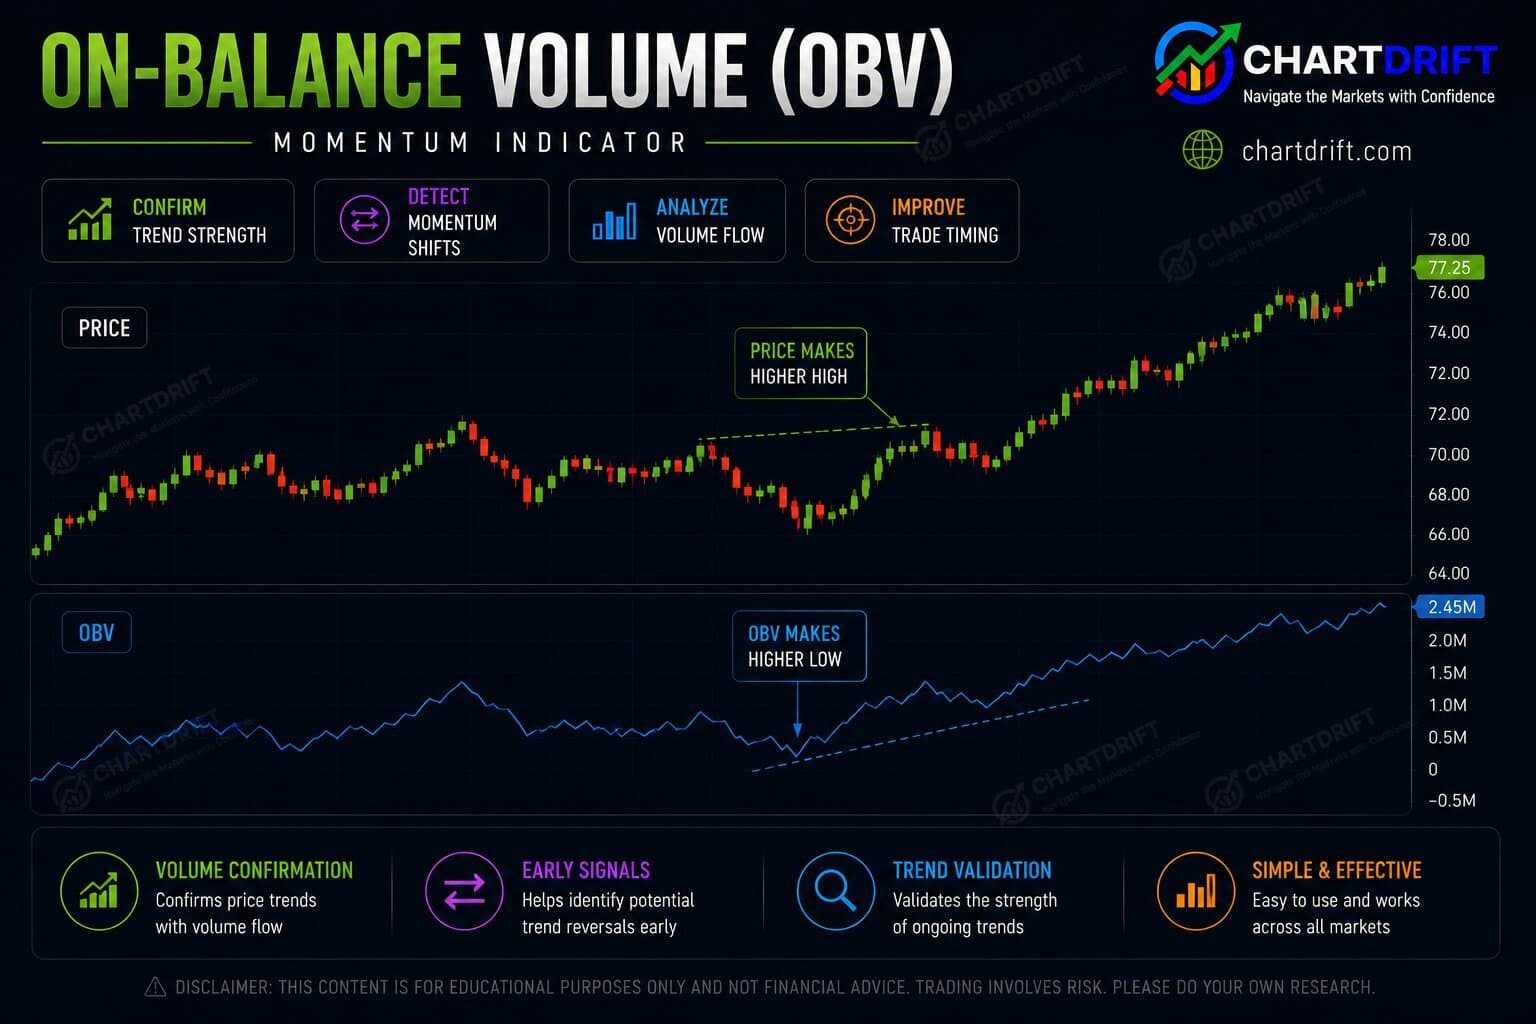
What is On-Balance Volume?
On-Balance Volume (OBV) is a popular volume indicator that helps traders understand whether buyers or sellers are becoming stronger in the market. It was created by Joe Granville and is based on a simple idea: volume often changes before price makes a major move.
Instead of looking only at price action, OBV tracks how trading volume flows in and out of the market. When price moves higher with strong volume, it usually shows buyers are in control. When price falls with increasing volume, it often signals growing selling pressure.
Rising OBV
When the OBV line moves upward, it suggests buying pressure is increasing and volume is supporting the uptrend. Traders often see this as a sign of bullish market strength.
Falling OBV
When the OBV line starts falling, it indicates that selling pressure is becoming stronger. This can be a warning that the market may continue moving lower or lose bullish momentum.
How It Works
OBV works by maintaining a running total of volume based on whether the market closes higher or lower compared to the previous candle.
If Close > Previous Close:
OBV = Previous OBV + Current Volume
If Close < Previous Close:
OBV = Previous OBV - Current Volume
If Close = Previous Close:
OBV = Previous OBV (unchanged)
The absolute value of OBV doesn't matter—what matters is its direction and whether it confirms or diverges from price action.
Trend Confirmation
The primary use of OBV is confirming price trends. When OBV moves in the same direction as price, it validates the trend's strength.
Bullish Confirmation
- Price making higher highs AND OBV making higher highs
- Strong uptrend with volume support
- Safe to add to long positions
- Trend likely to continue
Bearish Confirmation
- Price making lower lows AND OBV making lower lows
- Strong downtrend with volume support
- Avoid buying dips
- Consider short positions
OBV Divergences
The most powerful OBV signals come from divergences—when OBV and price move in opposite directions. This often precedes major trend reversals.
Bullish Divergence
Price makes lower lows but OBV makes higher lows. Accumulation occurring despite falling prices.
Bearish Divergence
Price makes higher highs but OBV makes lower highs. Distribution occurring despite rising prices.
Divergences are leading signals. A bearish divergence at a top warns that smart money is selling into strength. A bullish divergence at a bottom shows accumulation before a potential reversal.
Breakout Signals
OBV can confirm or reject breakouts by showing whether volume supports the move. This helps filter false breakouts.
Valid Breakout
- Price breaks above resistance
- OBV also breaks to new highs
- Volume confirms the move
- Enter with confidence
False Breakout Warning
- Price breaks above resistance
- OBV fails to confirm (stays flat or falls)
- Lack of volume support
- Wait for confirmation or avoid
Pro Tip
Apply a moving average to OBV (like 20-period) to smooth out noise and identify the overall trend more easily. OBV crossing above/below its MA can generate cleaner signals.
Frequently Asked Questions
What is On-Balance Volume (OBV)?
OBV is a cumulative volume indicator that adds volume on up closes and subtracts volume on down closes. It shows whether volume is flowing into or out of an asset. Rising OBV confirms uptrends; falling OBV confirms downtrends.
How do I use OBV for trend confirmation?
When price and OBV move in the same direction, the trend is confirmed. If price rises but OBV falls (or flattens), the rally may lack volume support and be vulnerable. Use OBV to validate breakouts and trend strength.
What is OBV divergence?
Bullish divergence: price makes a lower low but OBV makes a higher low—selling pressure may be weakening. Bearish divergence: price makes a higher high but OBV makes a lower high—buying pressure may be fading. Divergence can precede reversals.
Can OBV confirm breakouts?
Yes. A valid breakout often has OBV breaking to new highs (for upside) or new lows (for downside) with price. If price breaks but OBV does not confirm, the breakout may fail. Use OBV to filter false breakouts.
Should I use a moving average with OBV?
Applying an MA (e.g. 20-period) to OBV smooths noise and clarifies trend. OBV crossing above its MA can signal accumulation; crossing below can signal distribution. This can generate cleaner signals than raw OBV alone.