Morning StarPattern
The Morning Star is a classic three-candlestick bullish reversal pattern that appears after a downtrend. It signals that selling pressure is fading and buyers are beginning to regain control. While no candlestick pattern guarantees a trend reversal, the Morning Star is considered one of the more dependable reversal formations when it develops at a key support level and is confirmed by the following price action.
Every candlestick tells part of the market's story, and the Morning Star tells one of the clearest. The first candle reflects strong bearish momentum, the second shows hesitation as selling loses strength, and the third confirms that buyers have stepped in with confidence. Together, these three candles reveal a shift in market sentiment that traders often watch for before considering bullish opportunities.
This pattern appears across stocks, forex, cryptocurrencies, indices, and commodities because it reflects trader psychology rather than market-specific behavior. Learning how the Morning Star forms—and just as importantly, when it should be ignored—can help you recognize higher-quality reversal setups instead of reacting to every short-term bounce.
The Morning Star works best when combined with other technical tools such as support and resistance, volume analysis, trend structure, and momentum indicators. Treat it as one piece of evidence rather than a standalone trading signal.
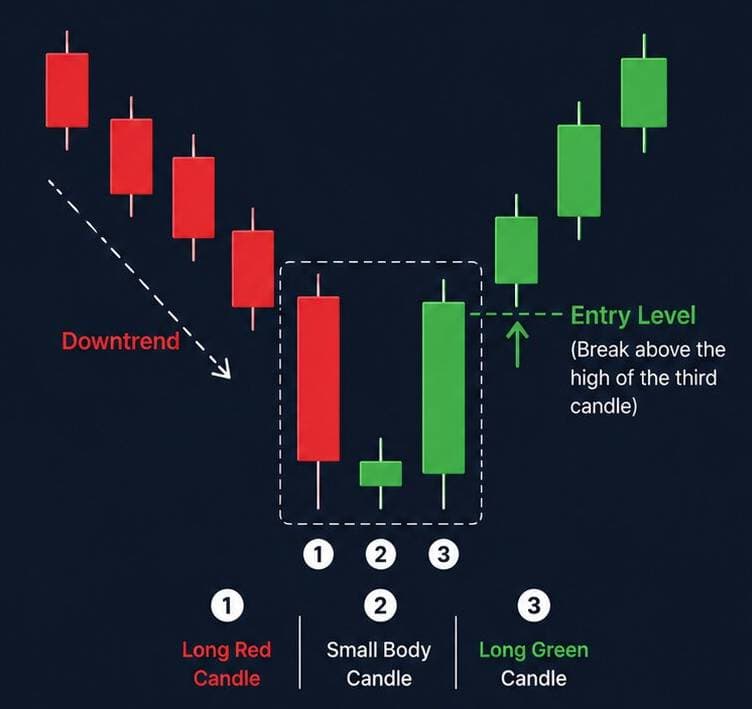
The Three-Act Structure
Each candle plays a different role in the reversal process. Understanding what each one represents makes the Morning Star easier to identify and far more meaningful than simply memorizing its shape.
Day 1: The Bearish Breakdown
A long bearish candle confirms sellers remain firmly in control. Fear dominates the market, momentum is negative, and most traders expect the downtrend to continue.
Day 2: The Pause
The second candle has a small real body, reflecting hesitation rather than strength from either side. Selling pressure begins to weaken while buyers quietly test the market.
Day 3: Buyers Take Control
A strong bullish candle closes well into the first candle's body, confirming that demand has returned. The stronger this recovery, the more convincing the reversal becomes.
The Psychology Behind the Morning Star
The Morning Star isn't just a chart pattern—it tells the story of how control gradually shifts from sellers to buyers over three trading sessions. Understanding that shift helps traders judge whether a reversal has genuine strength or is simply a temporary bounce.
Day 1 reflects confidence from sellers. The market is already trending lower, and another strong bearish candle reinforces the belief that prices will continue falling. Most participants remain focused on selling, while buyers stay on the sidelines.
Day 2 introduces uncertainty. After a prolonged decline, the market struggles to extend lower with the same momentum. The small-bodied candle represents balance rather than conviction. Sellers begin losing control, buyers start absorbing supply, and volatility often contracts as both sides reassess the next move.
Day 3 changes the narrative. Buyers return with enough strength to push prices higher and close well into the first bearish candle. This move often encourages new buying while forcing short sellers to cover their positions, creating additional upward pressure. The result is a clear transition from bearish sentiment to growing bullish confidence.
A Morning Star doesn't predict that prices must rise. Instead, it highlights that the market has moved from aggressive selling to increasing buyer participation. That's why experienced traders always look for confirmation from volume, nearby support, or broader market context before acting on the pattern.
The Gap's Importance
The gap between the first and second candles can strengthen the Morning Star, especially in stocks where overnight price gaps are common. However, many forex and cryptocurrency markets trade nearly around the clock, so visible gaps are less frequent. In those markets, the key factor isn't the gap itself—it's the clear loss of bearish momentum followed by a decisive bullish confirmation candle.
Identifying a Valid Morning Star Pattern
Not every three-candle formation qualifies as a Morning Star. A reliable setup follows a few key characteristics that show the market is genuinely shifting from bearish to bullish sentiment. Checking these conditions before entering a trade can help filter out weak or misleading signals.
Established Downtrend
The pattern should appear after a clear series of lower highs and lower lows. Without an existing bearish trend, the Morning Star loses much of its significance because there is no momentum to reverse.
Strong First Candle
The first candle should be a long bearish candle that reflects strong selling pressure. It confirms that bears were firmly in control before the potential reversal begins.
Small Middle Candle
The second candle should have a relatively small real body. It represents indecision, showing that bearish momentum is weakening as buyers begin to absorb selling pressure.
Bullish Confirmation
The third candle should close well into the body of the first bearish candle. A stronger close provides greater confidence that buyers have successfully regained control of the market.
Trading the Morning Star
The Morning Star becomes more useful when combined with a structured trading plan. Rather than entering as soon as the pattern appears, experienced traders wait for confirmation and define their risk before opening a position.
Entry Strategy
Wait for completion. Enter only after Day 3 closes with a strong bullish candle. Some traders enter at Day 3's close; others wait for a break above Day 3's high.
Stop Loss
Below the star (Day 2) low. This is the pattern's foundation. If price breaks below, the reversal has failed.
Targets
First target: The high of Day 1's body. Second target: Previous swing high or resistance level. Consider the pattern's overall height for projections.
Trade Example
The example below demonstrates how traders might apply the Morning Star within a complete trading plan. The numbers are for educational purposes only and should not be interpreted as trading recommendations.
- Day 1: Open $180, Close $175 (A strong bearish candle extends the existing downtrend and confirms heavy selling pressure.)
- Day 2: Open $174, Close $174.50, Low $173 (The market forms a small-bodied candle, showing that sellers are losing momentum while buyers begin stepping in.)
- Day 3: Open $175, Close $179, High $179.50 (A strong bullish candle closes deep into the first candle's body, completing the Morning Star pattern and confirming the potential reversal.)
Entry: $179.60 (after confirmation above Day 3's high)
Stop: $172.90 (below Day 2 low) = Risk $6.70
Target 1: $186.30 (1:1)
Target 2: $193.00 (1:2)
Educational Note
No candlestick pattern is accurate every time. Before acting on a Morning Star, confirm the setup with overall market structure, support levels, volume, or other technical analysis tools. A disciplined approach to risk management is often more important than the pattern itself.
Pattern Variations
The Morning Star has a few variations across different markets and timeframes. While the basic idea remains the same, small differences in candle formation can affect the strength of the signal. Understanding these variations helps traders recognize valid setups without becoming too rigid.
Morning Doji Star
When Day 2 is a perfect doji (open equals close), the signal is even stronger. The doji represents complete indecision—maximum exhaustion.
Evening Star
The bearish opposite. Forms at the top of uptrends with the pattern reversed. Same structure, opposite implications.
Common Mistakes
Many failed Morning Star trades happen because traders focus only on the candle pattern and ignore the surrounding market context. Avoiding these common mistakes can significantly improve pattern quality.
Entering Too Early
Buying before the third candle closes removes the confirmation that makes the Morning Star reliable. What appears to be a reversal can quickly turn into another bearish candle if buyers fail to maintain momentum.
Ignoring Market Context
A Morning Star forming in the middle of a sideways market carries less weight than one developing after a clear downtrend near a major support level. Always evaluate the broader trend before acting on the pattern.
Frequently Asked Questions
Why is the morning star considered a strong bullish reversal pattern?
The morning star is a three-candle pattern that shows a clear shift: first a bearish candle, then a small-body candle (indecision), then a strong bullish candle that closes well into the first candle’s body. That third candle confirms that buyers have taken control after a downtrend, which is why many traders treat it as a strong signal.
Does the middle candle in a morning star have to be a doji?
Not necessarily. The middle candle can be a doji, a spinning top, or any small-body candle. What matters is that it shows indecision—buyers and sellers in balance—between the first bearish candle and the third bullish one. A doji is common, but the pattern is valid with other small bodies.
Where should I place my stop loss when trading a morning star?
Place your stop loss below the low of the first candle (the bearish one) or below the low of the middle candle. If price breaks below that level, the reversal setup is invalidated. Some traders use the low of the recent swing for a wider stop.
How is the morning star different from the evening star?
The morning star forms after a downtrend and signals a bullish reversal: bearish candle, small body, then strong bullish candle. The evening star forms after an uptrend and signals a bearish reversal: bullish candle, small body, then strong bearish candle. Same structure, opposite direction.
Should I wait for the third candle to close before entering?
Yes. The pattern is only complete when the third candle closes. Entering before the close can lead to false signals if the third candle reverses. Many traders enter on the next candle or at the open of the next period for confirmation.