Pennant PatternChart Pattern
A short-term continuation pattern featuring a strong pole followed by a small symmetrical triangle (pennant) before the trend resumes.
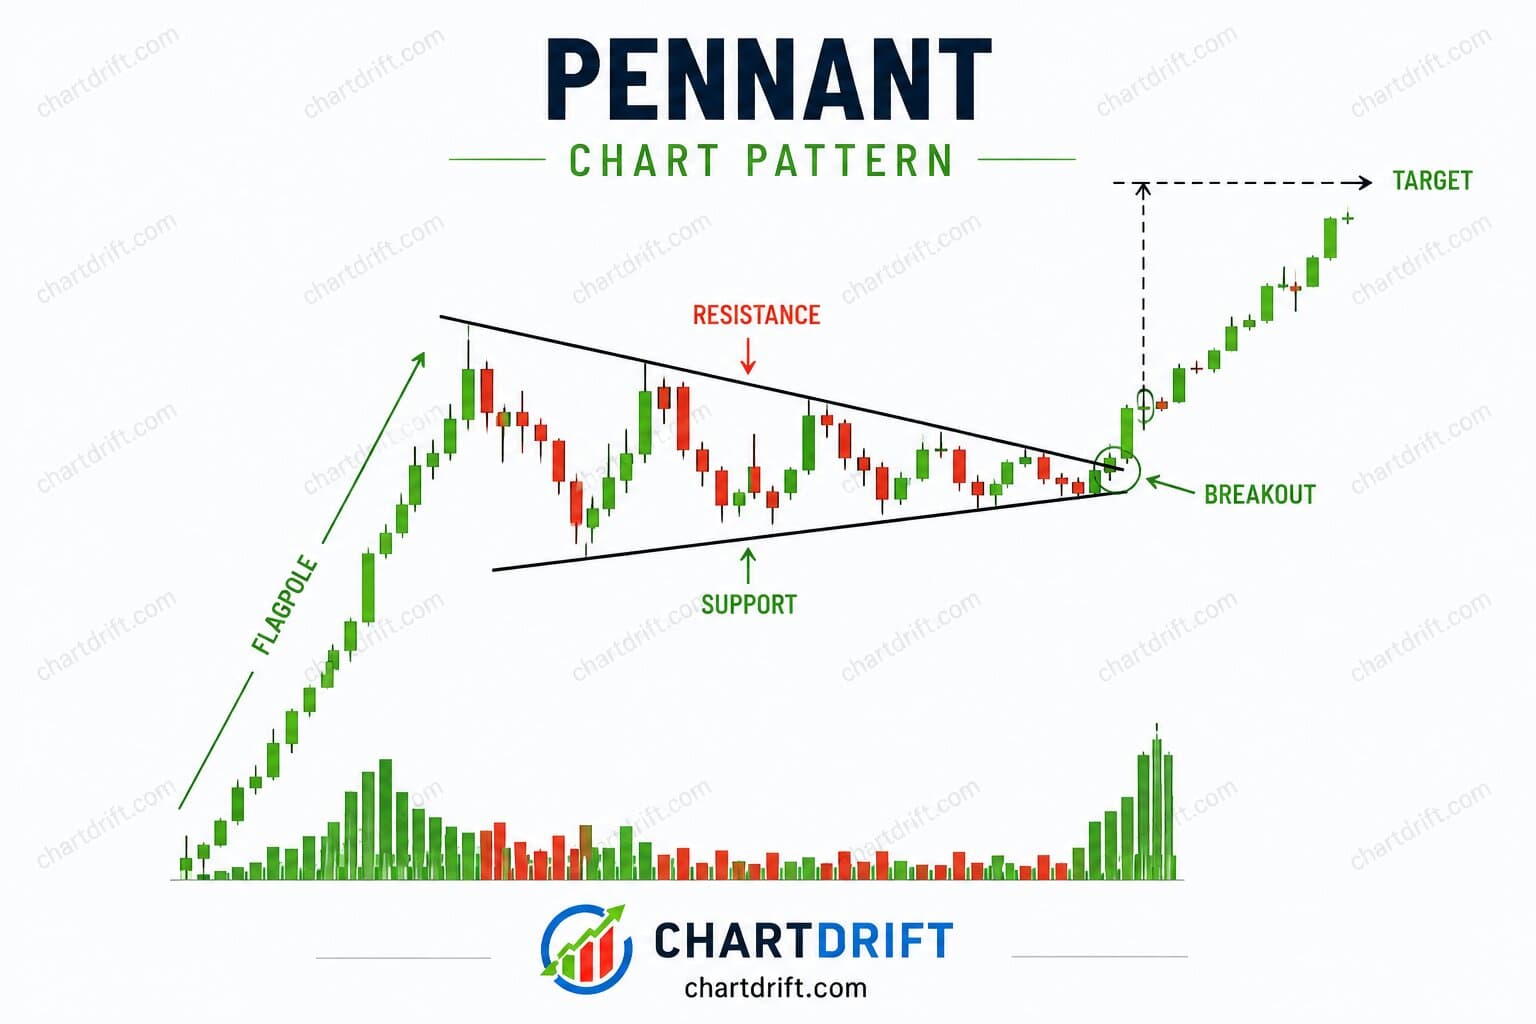
What is a Pennant Pattern?
The Pennant is a continuation pattern similar to a flag, but instead of a rectangular consolidation, price forms a small symmetrical triangle. It consists of a strong move (pole) followed by converging trendlines (pennant).
Pennants are typically shorter in duration than flags and represent a brief pause before the trend continues with similar momentum to the pole.
Market Psychology
After the strong pole move, both bulls and bears pause to reassess. The converging lines show decreasing volatility as the market compresses energy for the next move.
When the pennant breaks in the direction of the pole, it signals that the side that created the pole has regained control, and the move continues.
How to Identify
Strong Pole
A nearly vertical move with high volume—this is the "mast" of the pennant.
Symmetrical Pennant
Converging trendlines forming a small symmetrical triangle.
Declining Volume
Volume should decline during the pennant and spike on breakout.
Trading Strategies
Bull Pennant Entry
Enter long when price breaks above the upper trendline with increased volume. Stop-loss below the pennant low.
Bear Pennant Entry
Enter short when price breaks below the lower trendline with increased volume. Stop-loss above the pennant high.
Real Examples
Pennants typically form over 1-3 weeks and are highly reliable when they appear after strong momentum moves. They work on all timeframes from intraday to weekly charts.
The best pennants form quickly, maintain tight consolidation, and break out with decisive volume in the direction of the pole.
Common Mistakes
No Clear Pole
Without a strong pole move, the pattern loses its predictive power.
Strong Initial Move
Look for a pole with at least 10-15% move with high volume.
Frequently Asked Questions
What is the pennant chart pattern?
The pennant is a continuation pattern that appears after a strong move (the pole): a short consolidation with converging trendlines (a small triangle), then a breakout in the same direction. It represents a brief pause before the trend resumes. Bullish and bearish pennants both use the measured move for targets.
How is the pennant different from the flag?
The pennant has converging trendlines (a small triangle). The flag has parallel or near-parallel boundaries (a small channel). Both are short consolidations after a strong move and typically break in the direction of the prior trend. The measured move technique applies to both.
Where should I enter on a pennant pattern?
Enter when price breaks out of the pennant in the direction of the prior trend. For a bullish pennant, enter on a break above the pennant’s upper trendline. For a bearish pennant, enter on a break below the pennant’s lower trendline. Volume often increases on the breakout.
Where do I place my stop loss on a pennant trade?
Place your stop loss on the opposite side of the pennant from the breakout. For a bullish pennant, stop below the pennant’s lower trendline. For a bearish pennant, stop above the pennant’s upper trendline. Some traders use the low or high of the pole for a wider stop.
Does the pennant work on all timeframes?
Yes. The pennant can form on any timeframe. It tends to be more reliable when the pole is strong (e.g., 10–15% or more with high volume) and when the breakout is accompanied by increased volume. Shorter timeframes produce more pennants but also more noise.