Butterfly PatternHarmonic Trading
A powerful harmonic reversal pattern using precise Fibonacci ratios. The Butterfly provides accurate entry points at the Potential Reversal Zone (PRZ).
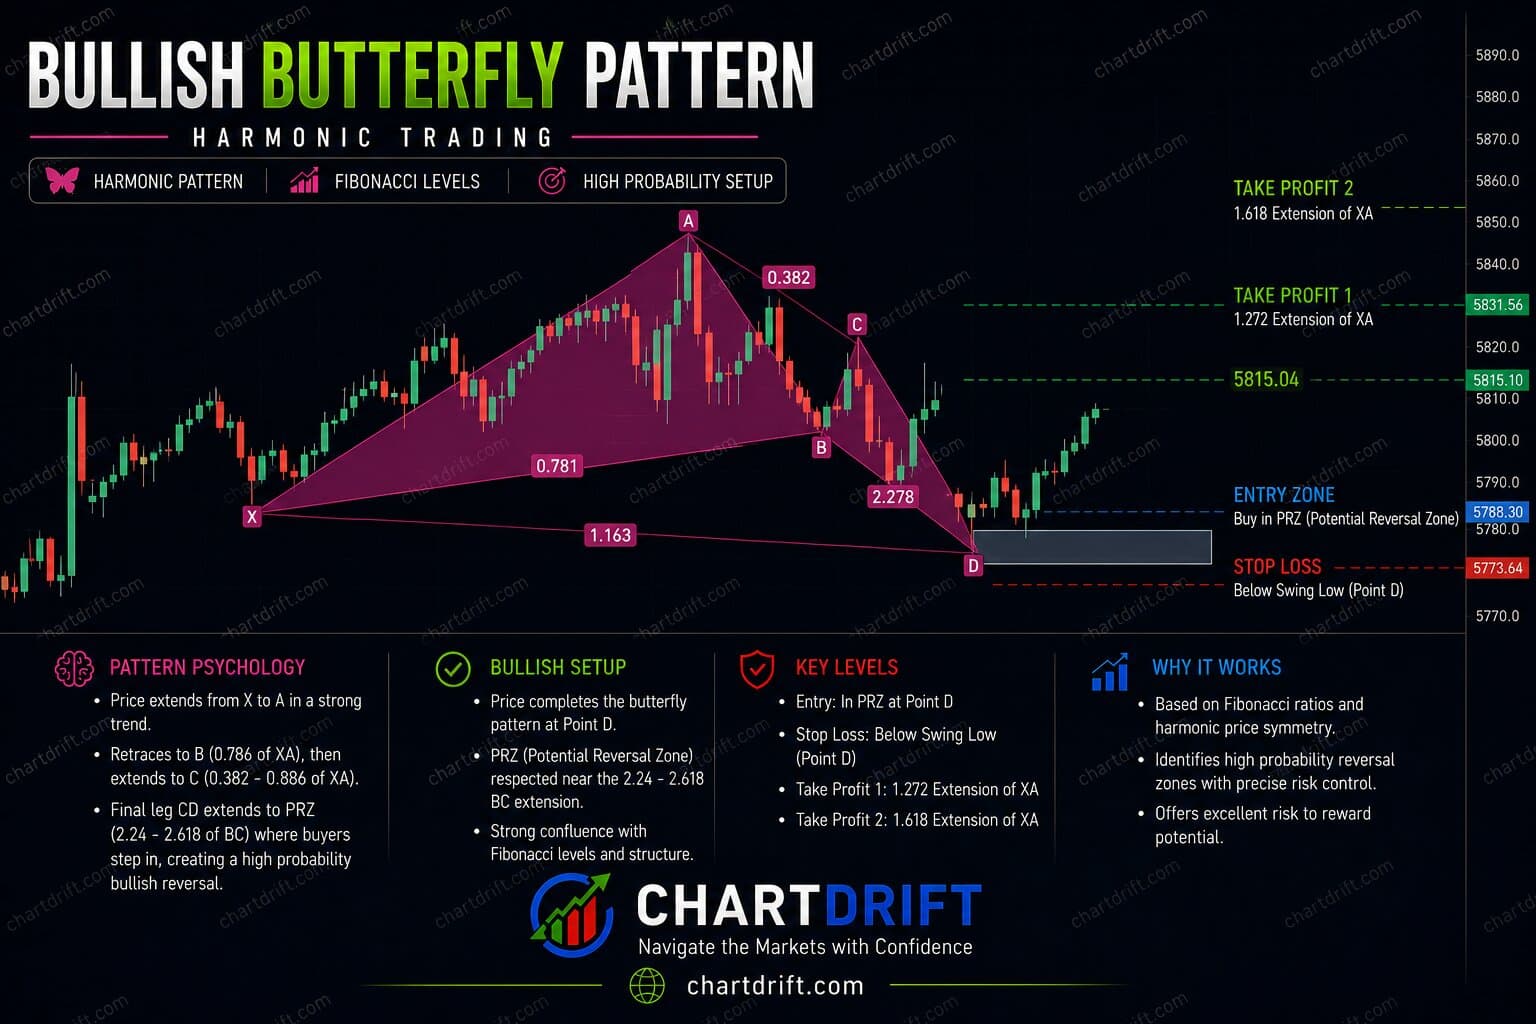
Key Characteristics
Understanding these essential features will help you identify the Butterfly pattern accurately.
Four-Leg Structure
The pattern consists of XA, AB, BC, and CD legs, each following specific Fibonacci ratios for precision trading.
Point D Beyond X
The most distinguishing feature—point D extends beyond the starting point X at 127.2% or 161.8% extension.
PRZ Trading
The Potential Reversal Zone at point D provides high-probability entry points for reversal trades.
What is the Butterfly Pattern?
The Butterfly Pattern is a harmonic reversal pattern made up of four legs labeled XA, AB, BC, and CD. Developed by Bryce Gilmore and refined by Scott Carney, it signifies a Potential Reversal Zone (PRZ) at point D where price is expected to change direction.
Key Insight
Unlike other harmonic patterns, the Butterfly's completion point (D) extends beyond the starting point X. This extension creates a stretched pattern that often leads to strong reversals.
How to Identify the Pattern
Structure and Fibonacci Levels
XA Leg
The initial price movement from point X to point A. This establishes the foundation of the pattern.
AB Leg (78.6% Retracement)
Retraces exactly 78.6% of the XA leg. This precise ratio is critical for pattern validity.
BC Leg (38.2% - 88.6%)
Retraces between 38.2% to 88.6% of the AB leg, creating the "wing" of the butterfly.
CD Leg (127.2% - 161.8% of XA)
Extends to 127.2% - 161.8% of XA and 161.8% - 261.8% of BC. Point D marks the PRZ.
Fibonacci Summary
| Leg | Ideal Fibonacci Level |
|---|---|
| AB | 78.6% of XA |
| BC | 38.2% – 88.6% of AB |
| CD | 127.2% – 161.8% of XA |
Trading Strategy
Entry at Point D (PRZ)
Enter at the Potential Reversal Zone: Wait for price to reach point D and confirm with candlestick patterns like doji, pin bar, or engulfing candles before entering.
Setting Stop Loss
Stop Loss Placement: Place your stop loss slightly beyond point D. For bullish Butterfly, place it below D. For bearish, place it above D.
Take Profit Targets
Multiple Targets: Use Fibonacci retracement of the CD leg. Target 1: 38.2% retracement. Target 2: 61.8% retracement. Target 3: Point A or full reversal.
Additional Confirmation
- RSI Divergence: Look for divergence at point D
- MACD Crossover: Bullish or bearish crossover near D
- Candlestick Patterns: Doji, pin bar, or engulfing at D
Risk Management
Risk-Reward Ratio
Harmonic patterns typically offer excellent risk-reward ratios of 1:2 or better due to tight stop losses at point D.
Pattern Validation
Only trade patterns that meet strict Fibonacci criteria. Invalid ratios significantly reduce the pattern's reliability.
Tips for Successful Trading
Validate Fibonacci Ratios
Ensure all legs meet the required Fibonacci ratios. A pattern with incorrect ratios has lower probability.
Wait for PRZ Confirmation
Don't enter blindly at point D. Wait for price action confirmation like reversal candlesticks.
Use Multiple Timeframes
Identify the pattern on higher timeframes for better reliability, then use lower timeframes for entry.
Example Trade Setup
Identify the Pattern
Spot a forming Butterfly pattern with XA leg established and AB retracing near 78.6%.
Validate Fibonacci Levels
Confirm BC retraces 38.2-88.6% of AB and CD is projecting to 127.2-161.8% of XA.
Wait for Point D
Let price reach the calculated PRZ zone. Don't anticipate—wait for it.
Confirm and Enter
Look for RSI divergence or reversal candlestick at D, then enter the trade.
Manage the Trade
Set stop beyond D, take partial profits at 38.2% retracement, trail the rest.
Conclusion
The Butterfly Pattern is a powerful tool for harmonic traders seeking precise entry and exit points. By mastering the Fibonacci ratios and waiting for proper confirmation at the PRZ, you can significantly improve your trade accuracy. Remember: validation is key—only trade patterns that meet the strict criteria.
Happy trading!
Frequently Asked Questions
What is the Butterfly harmonic pattern?
The Butterfly is a five-point harmonic pattern (X-A-B-C-D) that uses specific Fibonacci ratios to define reversal zones. The pattern often forms at the end of extended moves and indicates a potential reversal at point D, which lies beyond point X (unlike the Gartley). The bullish Butterfly has D below X; the bearish has D above X.
What are the key Fibonacci ratios for the Butterfly pattern?
The classic Butterfly uses: B retracement of XA at 78.6%; BC projection of 38.2% or 88.6% of AB; and XD extension where D is at 127% or 161.8% of XA. The 127% and 161.8% extensions are the most common for the Potential Reversal Zone (PRZ) at point D.
Is the Butterfly pattern bullish or bearish?
Both. A bullish Butterfly forms in a downtrend with point D below X—you look to buy at D. A bearish Butterfly forms in an uptrend with point D above X—you look to sell at D. The structure is the same; only the direction and placement of D change.
Where should I enter a trade on the Butterfly pattern?
Enter only when price reaches the Potential Reversal Zone (PRZ) at point D and shows confirmation, such as a reversal candlestick, RSI divergence, or support/resistance. Avoid entering early; wait for price to complete the D leg and then react from the PRZ.
What is the difference between the Butterfly and Gartley pattern?
In the Gartley, point D stays within the range of X (retracement of 78.6% of XA). In the Butterfly, point D extends beyond X—either below X in a bullish Butterfly or above X in a bearish one. The Butterfly typically appears after stronger, more extended moves and offers a larger reward zone.