What Is a Rising Wedge Pattern?
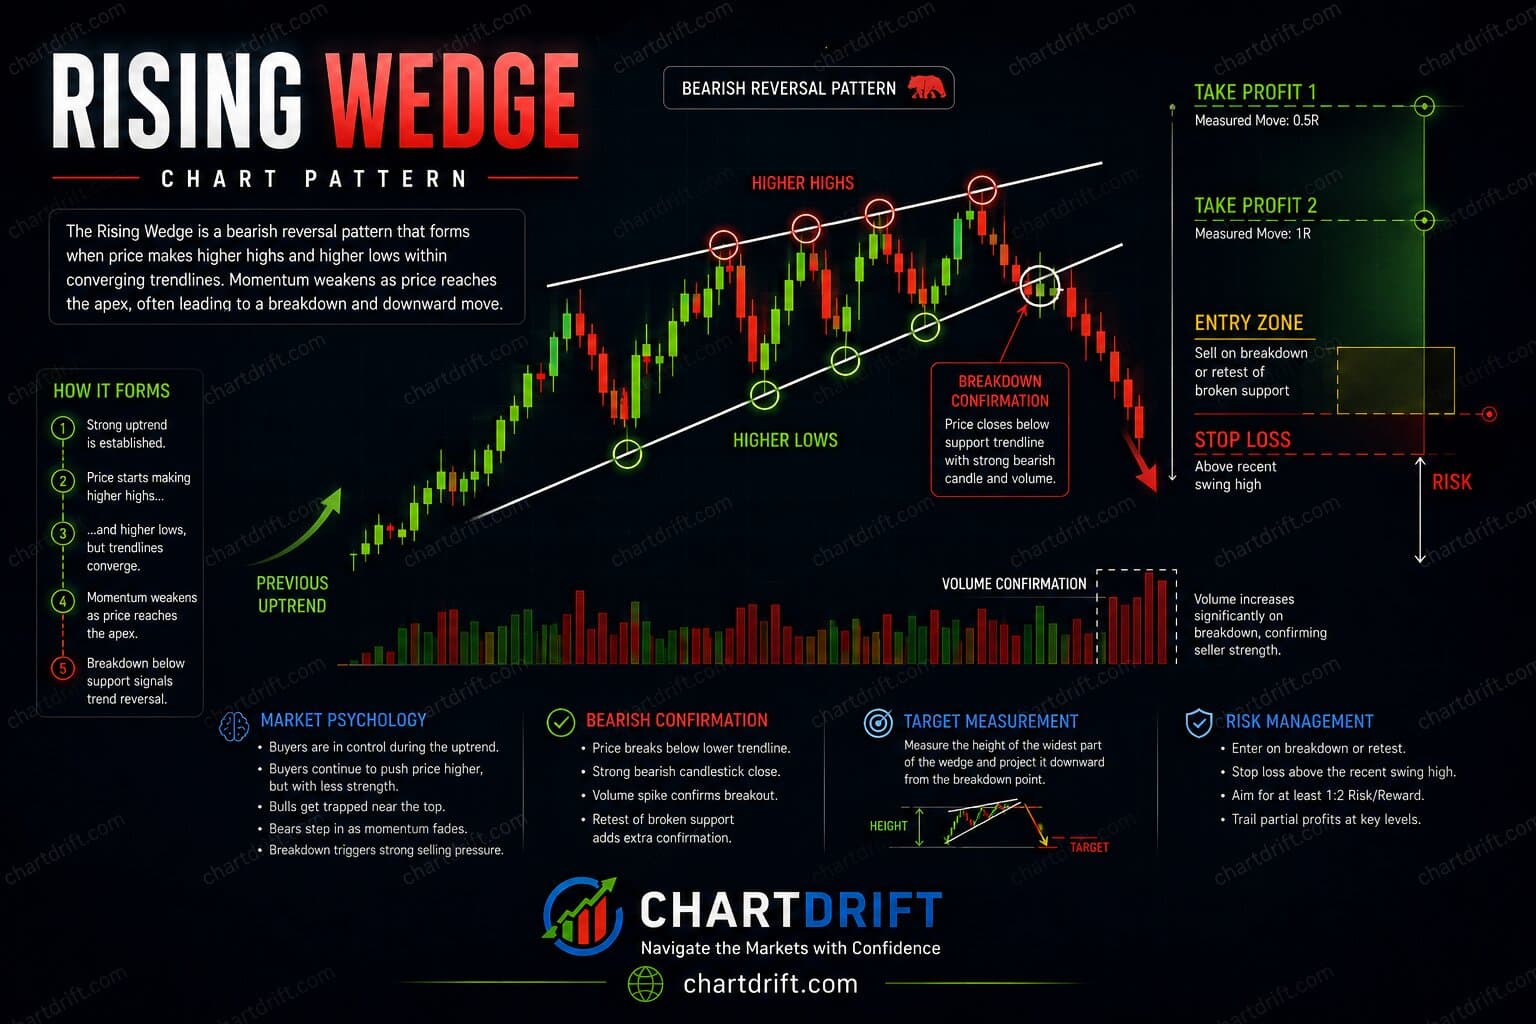
A Rising Wedge is a bearish chart pattern formed by two upward-sloping trendlines that gradually move closer together. Although price continues to rise, buying momentum weakens. A confirmed break below the lower trendline may signal that sellers are taking control and that a downward move could follow.
Pattern Snapshot
Pattern Type
Bearish Reversal / Continuation
Market Bias
Bearish
Difficulty
Beginner to Intermediate
Best Timeframes
1H, 4H, Daily, Weekly
Markets
Stocks, Forex, Crypto, Commodities, Indices
Confirmation
Trendline break, volume, price action
Key Takeaways
- A Rising Wedge forms during an upward price move.
- Both trendlines slope upward and converge.
- Buying momentum usually weakens as the pattern develops.
- Wait for a confirmed breakdown instead of guessing.
- Always combine the pattern with risk management.
Why Learn This Pattern?
Many beginners assume every rising market will continue climbing. The Rising Wedge teaches an important lesson: price direction and market strength are not always the same.
A market can still move higher while buyers slowly lose control. Learning to recognize this shift helps traders avoid chasing late entries and prepares them for possible reversals.
What You Will Learn
- Understand how a Rising Wedge develops.
- Draw the pattern correctly on a chart.
- Identify high-quality setups.
- Build a trading plan with entry, stop-loss, and targets.
Who Should Learn This Pattern?
- Beginners learning technical analysis.
- Swing traders looking for reversal opportunities.
- Day traders who trade breakout setups.
- Forex, stock, and crypto traders.
No advanced trading knowledge is required. If you understand basic candlesticks, this guide will help you take the next step toward reading market structure with greater confidence.
What Is a Rising Wedge Pattern?
A Rising Wedge forms when price continues making higher highs and higher lows, but each new move upward becomes smaller than the last. Two upward-sloping trendlines contain price action and gradually move closer together.
At first glance, the pattern can look bullish because price is still rising. The slowing pace of the advance tells the deeper story: buyers are still present, but they are acting with less conviction.
Why Does the Pattern Form?
Early in an uptrend, strong demand pushes prices higher with ease. As prices continue rising, some traders begin taking profits while others hesitate to buy at increasingly expensive levels.
New highs still form, but each rally covers less distance. This gradual shift in balance creates the narrowing shape of the Rising Wedge.
Market Psychology
Imagine climbing a steep hill. At the beginning, you have plenty of energy and move quickly. Near the top, every step becomes harder even though you are still moving upward.
The Rising Wedge reflects the same idea. Buyers control the early move, but their pressure weakens while sellers slowly become more active.
The Story Behind the Pattern
- Buyers are confident and push prices higher.
- Sellers begin defending higher prices, but buyers still make new highs.
- Each rally becomes weaker than the previous one.
- Buyers struggle to hold support, sellers gain control, and price breaks lower.
Bullish vs Bearish Context
Bearish Reversal
When the pattern develops after a strong uptrend, it may signal that buyers are becoming exhausted and a downward reversal is possible.
Bearish Continuation
When it forms during a temporary rally inside a larger downtrend, the breakdown often signals that the primary bearish trend is ready to continue.
Pattern Anatomy
Upper Trendline (Resistance)
Connects a series of higher highs and shows where sellers begin defending price.
Lower Trendline (Support)
Connects higher lows and often rises faster than resistance.
Breakout Zone
The pattern is confirmed when price closes below the lower trendline with supporting evidence.
How to Draw a Rising Wedge Correctly
- Confirm that price is already moving upward.
- Mark at least two higher highs.
- Mark at least two higher lows.
- Draw the upper trendline through the highs.
- Draw the lower trendline through the lows.
- Check that both lines slope upward and converge.
- Wait for a confirmed breakdown before treating it as valid.
Identification Checklist
- Is there an existing uptrend or upward correction?
- Are both trendlines sloping upward?
- Are the trendlines converging?
- Are higher highs becoming smaller?
- Is price respecting both trendlines?
- Is volume gradually decreasing?
- Has price broken below the lower trendline?
- Is there confirmation from price action?
Valid vs Invalid Rising Wedge
A Valid Pattern
- Clear higher highs and higher lows.
- Converging upward trendlines.
- Gradually declining volume.
- A decisive bearish breakdown.
An Invalid Pattern
- Trendlines are almost parallel.
- Price repeatedly breaks both lines.
- There is no clear trend beforehand.
- The pattern forms in a choppy sideways market.
Volume Analysis
Volume tells you how much conviction is behind a price move. During a Rising Wedge, volume often decreases even though price continues climbing.
When the lower trendline breaks, traders look for volume to increase. Rising volume during the breakdown shows sellers are becoming more active.
Practical Tips
- Declining volume during formation is generally healthy.
- Expanding volume on breakdown strengthens confirmation.
- Weak volume calls for extra caution.
Confirmation Signals
A Rising Wedge is not confirmed until price breaks below the lower trendline. Look for a strong bearish close, higher volume, a failed retest, divergence, or a break of the most recent higher low.
Entry Strategy
- Conservative: enter after a candle closes below support.
- Retest: enter if price retests broken support and fails.
- Aggressive: enter as soon as support breaks, with higher false-breakout risk.
Stop Loss Placement
Common stop locations include above the most recent swing high, above the upper wedge line, or above the candle that confirms the breakdown.
Profit Targets
Common target methods include previous support, Fibonacci levels, the wedge height projected downward, and partial profits with a trailing stop.
Risk-to-Reward
Before taking the trade, compare your possible loss with your realistic target. Many traders skip setups where reward is smaller than risk.
Multi-Timeframe Analysis
Use the higher timeframe for trend context, the trading timeframe for the wedge, and a lower timeframe only to fine-tune confirmed entries.
Winning Trade Example
Imagine a stock trending upward for several weeks. The price begins forming a Rising Wedge: highs are still increasing, each new rally is smaller, and volume starts to decline.
- Spot two upward-sloping trendlines moving closer together.
- Wait for a bearish candle to close below support with higher volume.
- Plan entry after confirmation, stop above the recent swing high, and targets at prior support and the measured move.
- Take partial profits and trail the rest if bearish momentum continues.
Failed Trade Example
A trader notices a Rising Wedge and shorts before the lower trendline is broken. The next day, buyers step back in and price breaks above the upper trendline instead.
- The pattern had not been confirmed.
- Volume did not support a bearish move.
- The broader market trend remained strongly bullish.
What Went Right in the Successful Trade?
- The pattern formed after a strong uptrend.
- Trendlines were clear and easy to draw.
- Volume declined during the wedge and increased on breakdown.
- Risk and reward were planned before entry.
What Can We Learn?
Charts do not predict the future. They help you prepare for possible outcomes. Professional traders ask whether the setup is valid, whether the market confirmed it, whether risk is acceptable, and whether the trade fits the plan.
Common Mistakes Traders Make
- Trading before confirmation.
- Ignoring the overall trend.
- Drawing forced trendlines.
- Forgetting volume.
- Risking too much on one setup.
Professional Trading Tips
- Wait for the candle to close before confirming breakdown.
- Trade only the clearest wedge formations.
- Combine the pattern with support and resistance.
- Accept that missing a trade is better than forcing one.
When NOT to Trade a Rising Wedge
- Major economic news is about to be released.
- The pattern forms inside a choppy sideways market.
- Trendlines are unclear.
- Volume and price action disagree.
- Risk-to-reward does not fit your plan.
Understanding False Breakouts
False breakouts happen when price briefly moves below the lower trendline before reversing higher. Wait for a candle close, look for increasing volume, and avoid reacting to a single spike.
Risk Management Mindset
Good traders focus on process and capital protection: written plans, sensible position sizing, consistency, and learning from both wins and losses.
Rising Wedge vs Falling Wedge
| Feature | Rising Wedge | Falling Wedge |
|---|---|---|
| Market Bias | Usually Bearish | Usually Bullish |
| Trendlines | Both slope upward | Both slope downward |
| Common Outcome | Breakdown | Breakout |
Rising Wedge vs Ascending Triangle
| Feature | Rising Wedge | Ascending Triangle |
|---|---|---|
| Upper Trendline | Slopes upward | Nearly horizontal |
| Typical Signal | Bearish | Bullish |
| Breakout Direction | Usually downward | Usually upward |
Does the Pattern Work in Stocks, Forex, and Crypto?
Stocks: often appear before earnings, after strong rallies, or near major resistance.
Forex: useful in trending currency pairs with support and resistance context.
Crypto: works, but volatility requires more patience and position control.
Indices and commodities: can reflect broader sentiment shifts around macro events.
Best Timeframes for Trading
15m and 30m: useful for active traders but noisier.
1H and 4H: balanced for swing traders.
Daily: cleaner and more significant.
Weekly: less frequent, but often more meaningful.
Before You Trade Checklist
- Is there a clear trend before the pattern forms?
- Are both trendlines easy to draw?
- Do the trendlines converge?
- Is volume decreasing during the pattern?
- Has price closed below the lower trendline?
- Is your stop-loss level defined?
Practice Exercise
Open a daily chart for any actively traded stock. Ask whether the market is trending, whether higher highs and higher lows are visible, whether both trendlines can be drawn without forcing them, and what would confirm a bearish breakdown.
Quiz Yourself
- When is a Rising Wedge complete? Answer: after price closes below the lower trendline with confirmation.
- What usually happens to volume? Answer: it often decreases as buying momentum weakens.
- Can it appear in a downtrend? Answer: yes, as bearish continuation.
- Should every wedge be traded? Answer: no, only clear setups with acceptable risk.
Frequently Asked Beginner Questions
How long does it take to form?
Intraday wedges can form within hours, while daily or weekly wedges can take days or weeks.
Can the pattern fail?
Yes. No chart pattern is guaranteed. Confirmation and risk management are essential.
Do I need indicators?
No. The pattern can be read from price action, but volume, RSI, and support or resistance can help confirm it.
Frequently Asked Questions
Conclusion
The Rising Wedge Pattern is more than two converging trendlines. It tells the story of a market where buyers are still pushing prices higher, but each advance requires more effort than the last.
The pattern does not predict the future. It highlights an area where the market may be changing direction. Waiting for confirmation, following a trading plan, and managing risk are more important than trying to predict every move.
Key Summary
- Rising Wedge is usually a bearish pattern.
- It forms with two upward-sloping converging trendlines.
- Buying momentum often weakens during formation.
- Wait for confirmation before entering a trade.