Falling WedgeChart Pattern
Bullish Reversal Pattern
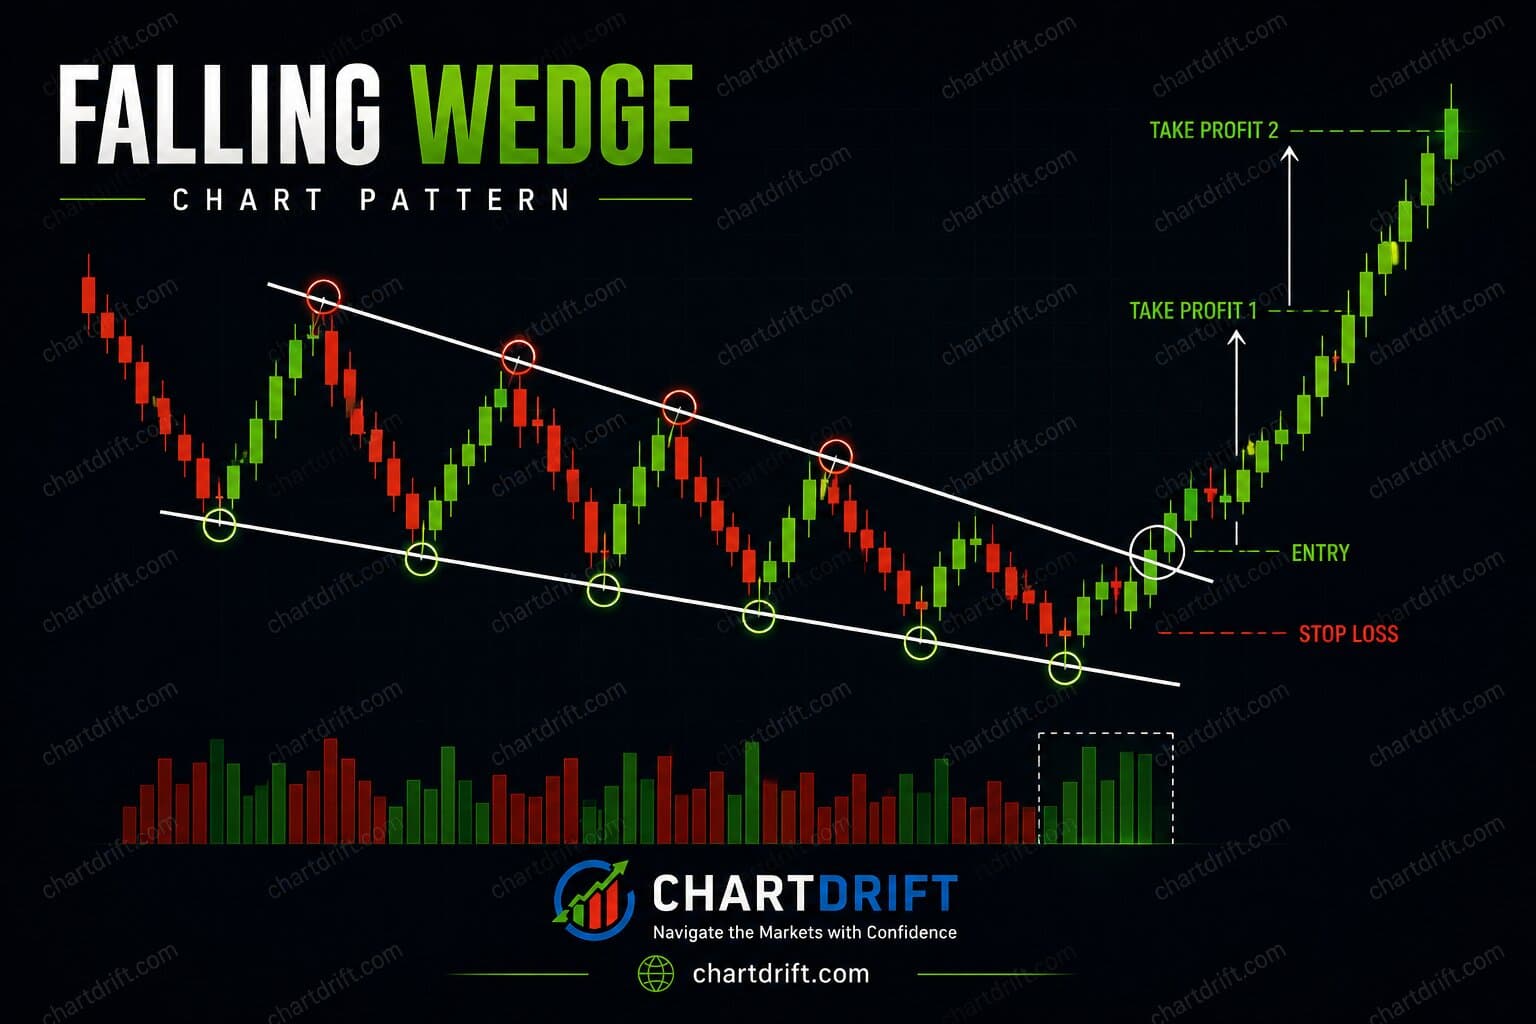
The Falling Wedge is a bullish chart pattern that forms when price creates lower highs and lower lows while the two downward-sloping trendlines gradually converge. As the trading range narrows, selling pressure weakens and buyers begin to regain control. A breakout above the upper trendline often signals the start of a new bullish move.
Unlike many reversal patterns, the Falling Wedge can appear after a prolonged downtrend or during a temporary pullback within an existing uptrend. In both cases, traders look for strong breakout confirmation, increasing volume, and proper risk management before entering a position.
Bullish Reversal
Typically signals that bearish momentum is fading and buyers are preparing to regain control.
High Reliability
Produces stronger results when confirmed by volume, market structure, and trend analysis.
Clear Structure
Easy to recognize using two converging downward-sloping trendlines.
Risk Reward
Defined breakout, stop-loss, and target levels make trade planning straightforward.
What is a Falling Wedge?
The Falling Wedge is a bullish chart pattern formed by two downward-sloping trendlines that gradually converge toward each other. The upper trendline connects a series of lower highs, while the lower trendline connects lower lows with a shallower slope. As the distance between the two lines decreases, price volatility contracts and selling pressure begins to weaken.
Although price continues moving lower during formation, the declining momentum suggests sellers are losing control. Eventually, buyers gain enough strength to push price above the upper resistance line. When this breakout occurs with increased trading volume, it often marks the beginning of a bullish reversal or the continuation of an existing uptrend.
The pattern appears across stocks, forex, cryptocurrencies, commodities, and indices, making it one of the most widely recognized continuation and reversal formations in technical analysis.
Market Psychology
Understanding why the Falling Wedge forms is often more valuable than simply recognizing its shape.
Strong Selling Pressure
The pattern begins with aggressive selling that pushes price to new lows. At this stage, sellers remain in control and market sentiment is largely bearish.
Weakening Momentum
Although price continues making lower highs and lower lows, each new decline becomes smaller than the previous one. This indicates sellers are gradually losing conviction.
Price Compression
As volatility decreases and both trendlines converge, buyers begin absorbing selling pressure. The narrowing range often precedes a significant expansion in volatility.
Bullish Breakout
Once buyers overcome resistance, price breaks above the upper trendline. Increasing volume and a strong bullish candle often confirm the breakout and improve its reliability.
How to Identify a Falling Wedge
Downward Sloping Resistance
Draw a trendline connecting at least two lower highs. This line should slope downward and act as dynamic resistance throughout the pattern.
Downward Sloping Support
Connect the lower lows using another downward-sloping trendline. Unlike the resistance line, the support line usually declines at a slower angle, causing both lines to converge.
Converging Trendlines
The distance between support and resistance should gradually decrease as the pattern develops. This compression reflects weakening bearish momentum.
Breakout Confirmation
Wait for price to close above the upper trendline. Ideally, the breakout should occur with higher-than-average trading volume or strong bullish momentum.
Trading Strategies
Breakout Strategy
Rather than entering while the pattern is still forming, many traders wait for a confirmed breakout above resistance. This reduces the risk of false breakouts and improves overall trade quality. Traders often combine the breakout with RSI, MACD, and volume analysis to confirm momentum and participation.
Entry
Enter after a candle closes above the upper trendline or after a successful retest of the breakout level.
Stop Loss
Place the stop-loss below the most recent swing low or just beneath the lower wedge trendline.
Targets
Measure the maximum height of the wedge and project that distance upward from the breakout point. Nearby resistance levels may also serve as realistic profit targets.
Risk-Reward
Aim for a minimum 1:2 risk-to-reward ratio before entering any trade. Avoid setups that do not provide sufficient upside potential.
Real Examples
This Bitcoin 4-hour chart illustrates a classic Falling Wedge during a corrective phase.
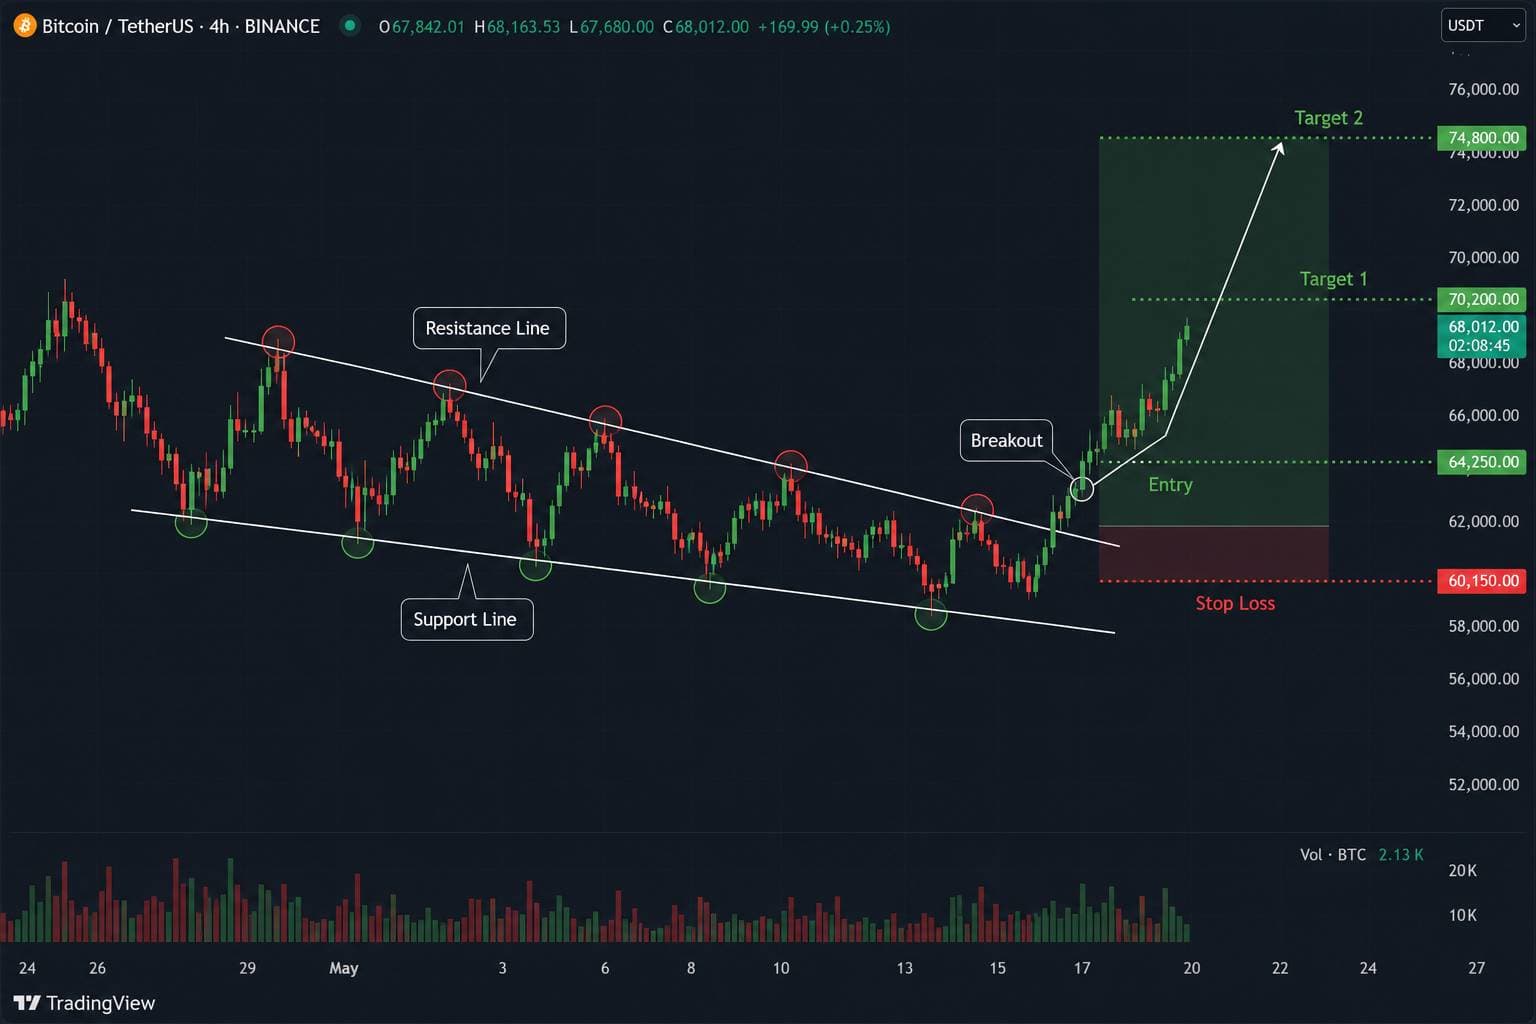
Price forms consecutive lower highs and lower lows while both trendlines gradually converge. As selling momentum fades, buyers begin absorbing supply near support. Once price closes above the upper resistance line with increasing volume, the breakout confirms the pattern.
A long position can be considered after confirmation, with a stop-loss below the recent swing low and profit targets projected using the wedge's maximum height.
This example demonstrates why waiting for confirmation generally produces more reliable trades than anticipating the breakout before it occurs.
Common Mistakes
Confusing It with a Descending Channel
A Falling Wedge has converging trendlines. A descending channel uses nearly parallel trendlines and behaves differently.
Entering Too Early
Many traders buy before the breakout is confirmed. Waiting for a candle close above resistance helps reduce false signals.
Ignoring Volume
A breakout accompanied by rising volume provides stronger confirmation than a breakout occurring during low market participation.
Ignoring the Overall Trend
Falling Wedges are more reliable when aligned with the broader market trend or formed after extended downtrends.
Trading Without a Stop-Loss
No chart pattern is perfect. Always define risk before entering a trade and avoid risking more than a small percentage of your trading capital.
Frequently Asked Questions
What is a Falling Wedge pattern?
A Falling Wedge is a bullish chart pattern formed by two downward-sloping converging trendlines. It often signals that selling pressure is weakening and buyers may soon regain control. Traders typically wait for a breakout above resistance before considering long positions.
Is the Falling Wedge bullish or bearish?
The Falling Wedge is generally considered a bullish pattern. It can act as either a reversal after a downtrend or a continuation pattern during an existing uptrend, depending on where it forms.
How reliable is the Falling Wedge?
When confirmed by volume, trend analysis, and a decisive breakout, the Falling Wedge is regarded as one of the more reliable bullish chart patterns. However, no pattern guarantees success, so proper risk management remains essential.
What is the best timeframe?
The pattern works on nearly every timeframe, from intraday charts to weekly charts. Higher timeframes generally produce stronger and more reliable signals because they contain less market noise.
How do you confirm a Falling Wedge breakout?
Look for a strong candle closing above the upper trendline, preferably supported by increasing trading volume or additional confirmation from momentum indicators such as RSI or MACD.
Where should I place the stop-loss?
A common approach is to place the stop-loss below the most recent swing low or beneath the lower trendline of the wedge. This protects against failed breakouts while maintaining a favorable risk-to-reward ratio.
What is the price target?
Many traders estimate the target by measuring the widest part of the wedge and projecting that distance upward from the breakout point. Previous resistance levels can also be used as potential profit targets.
Can the Falling Wedge fail?
Yes. False breakouts occur in all markets. This is why experienced traders wait for confirmation, manage risk carefully, and avoid relying on chart patterns alone.
Related Pattern and Indicator Guides
Related chart patterns
Confirmation indicators
Master Chart Patterns. Trade with Confidence.
Explore our in-depth guides, real-world examples, and proven strategies to improve your trading skills and decision-making.