AB=CD Pattern
The Foundation of Harmonic Trading
The AB=CD Pattern is one of the most recognized harmonic trading patterns because it teaches a simple but powerful principle: markets often move in balanced price swings. When one directional move closely matches another in both price and time, the market may be approaching an area where the current trend begins to lose momentum.
Unlike many chart patterns that rely solely on price formations, the AB=CD pattern combines price action, Fibonacci retracements, and market symmetry. This structured approach helps traders identify potential reversal zones with greater precision rather than relying on guesswork.
The pattern can develop in stocks, forex, cryptocurrencies, commodities, and indices, making it useful across nearly every liquid financial market. Whether you're learning harmonic trading for the first time or refining an existing strategy, understanding the AB=CD pattern provides the foundation for recognizing more advanced harmonic structures such as the Gartley, Bat, Butterfly, and Crab patterns.
It's important to remember that the AB=CD pattern does not predict future price movements with certainty. Instead, it identifies areas where buyers and sellers may be reaching equilibrium, increasing the probability of a meaningful price reaction. Successful traders always combine the pattern with confirmation signals, market context, and disciplined risk management.
Quick Pattern Snapshot
- Pattern Type
- Harmonic Reversal
- Market Bias
- Bullish & Bearish
- Difficulty
- Intermediate
- Reliability
- Moderate - High
- Best Markets
- Stocks, Forex, Crypto, Commodities, Indices
- Best Timeframes
- 1H, 4H, Daily, Weekly
- Key Tools
- Fibonacci Retracement, Extension, Price Action
- Confirmation
- Candlestick Patterns, Volume, Support & Resistance
- Risk Level
- Moderate
- Works With
- Trend Analysis & Risk Management
Key Takeaways
Measures Market Symmetry
CD leg should be equal to the AB leg in length.
Uses Fibonacci Ratios
BC retraces 61.8%-78.6%; CD equals AB.
Works in Multiple Markets
Applicable in stocks, forex, crypto, and more.
Wait for Confirmation
Look for price action, volume, or momentum confirmation.
Risk Management Is Key
Always use stop loss and define R:R before entering.
Combine with Confluence
Stronger when aligned with trend, S/R, and indicators.
What Is the AB=CD Pattern?
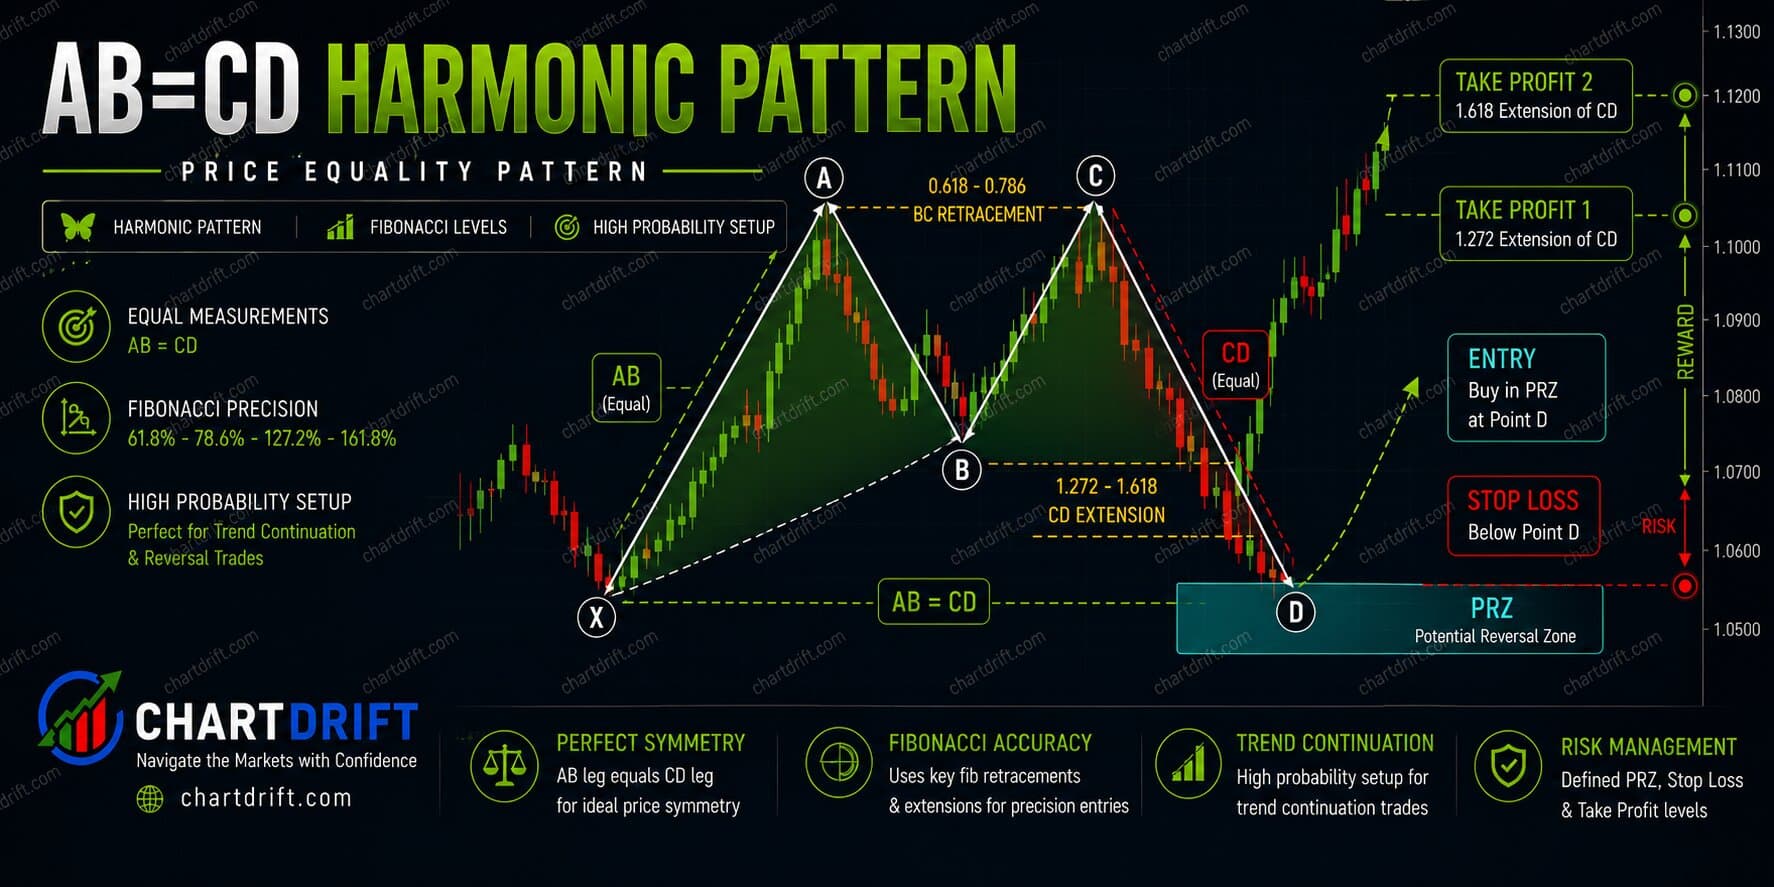
The AB=CD is the simplest harmonic pattern and serves as the starting point for understanding harmonic trading. It consists of four price points, A, B, C, and D, and two nearly equal price swings.
Unlike many chart patterns that rely mainly on price shape, the AB=CD pattern combines price action, Fibonacci retracements, and market symmetry. Traders use it to define a Potential Reversal Zone instead of guessing where a move may end.
Why Traders Use the AB=CD Pattern
Markets rarely move in straight lines. Instead, they trend, retrace, and continue in measured waves. The AB=CD pattern provides a structured framework for measuring those waves objectively.
- Uses objective Fibonacci measurements.
- Identifies logical reversal zones.
- Supports disciplined risk management.
- Works across multiple financial markets.
- Forms the basis for advanced harmonic patterns.
Rather than predicting where the market must reverse, the AB=CD pattern highlights areas where a reversal becomes more likely. Experienced traders combine the pattern with market structure, confirmation signals, and proper trade management before making trading decisions.
Market Psychology
1. Sellers in Control
Momentum shifts as the market moves from impulse to retracement and into the reversal zone.
2. Profit Taking
Momentum shifts as the market moves from impulse to retracement and into the reversal zone.
3. Market Indecision
Momentum shifts as the market moves from impulse to retracement and into the reversal zone.
4. Buyers Step In
Momentum shifts as the market moves from impulse to retracement and into the reversal zone.
How the Pattern Forms
The AB=CD pattern consists of four points and two price swings that should be equal in length.
A -> B
Initial impulse move in the trend direction.
B -> C
Retracement of 61.8% - 78.6% of the AB leg.
C -> D
Extension that equals the length of the AB leg.
D
Potential reversal zone. Look for confirmation.
Fibonacci Cheat Sheet
Pattern Checklist
- Is there a clear trend before point A?
- Is Point D near support / resistance?
- Is AB an impulsive move?
- Do I have confirmation?
- Does BC retrace 61.8% - 78.6% of AB?
- Is Risk:Reward at least 1:2?
- Does CD equal the length of AB?
- Is my stop loss clearly defined?
Bullish vs Bearish AB=CD
| Factor | Bullish AB=CD | Bearish AB=CD |
|---|---|---|
| Appears In | Downtrend | Uptrend |
| Expected Move | Price reversal up | Price reversal down |
| Trade Setup | Buy near Point D | Sell near Point D |
| Key Zone | Support / Demand | Resistance / Supply |
| Confirmation | Bullish signals | Bearish signals |
| Invalidation | Below Point D | Above Point D |
Confirmation Signals Before Entering a Trade
One of the biggest mistakes traders make is entering as soon as price reaches Point D. Point D is a Potential Reversal Zone (PRZ), not an automatic trade signal.
Reversal Candlestick Patterns
Volume Confirmation
- Rising volume on the reversal candle
- Declining volume during the CD leg
- Volume spike near Point D
Momentum Divergence
- RSI Divergence
- MACD Divergence
- Stochastic Divergence
Confluence
- Support & Resistance
- Trendlines
- Supply & Demand
- Fibonacci Levels
Pro Tip: Wait for confirmation instead of predicting the reversal.
Trading Strategy
Entry
Wait for price to reach Point D, then look for confirmation before entering.
Stop Loss
Place the stop just beyond Point D or outside the Potential Reversal Zone.
Targets
Use Fibonacci retracements of CD, Point C, or nearby market structure.
Risk Management
Position Size
Risk only a small portion of your trading capital on any single setup.
Stop Loss
Common locations include beyond Point D, outside the PRZ, or beyond the latest swing high or low.
Profit Targets
Target 1: 38.2% retracement. Target 2: 61.8% retracement. Target 3: previous support or resistance.
Risk-to-Reward
Choose trades where the potential reward justifies the predefined risk.
Real Trade Example
- 1. Price rallies from $100 to $150.
- 2. Price retraces to $119, near the 61.8% Fibonacci level.
- 3. The projected completion zone is around $169.
- 4. A bearish engulfing candle confirms the reversal.
- 5. Use a stop-loss above the PRZ and scale out at planned profit targets.
Key Lesson: Follow a repeatable process instead of trying to predict the exact turning point.
Failed Trade Example
A trader enters immediately at Point D without waiting for confirmation. The trend continues instead of reversing.
- No reversal candlestick
- No momentum divergence
- Strong trend remained intact
- Volume supported continuation
- Market news accelerated the move
Common Mistakes
- Trading against the primary trend without stronger confirmation
- Entering as soon as price reaches Point D
- Forcing patterns when Fibonacci measurements do not align naturally
- Poor risk management or undefined position size
- Ignoring major news events that can invalidate technical patterns
Advantages vs Limitations
| Advantages | Limitations |
|---|---|
| Objective Fibonacci measurements | No pattern guarantees a reversal |
| Clear entry, stop-loss, and target planning | Requires patience and confirmation |
| Works across multiple financial markets | False signals occur in volatile markets |
| Easy foundation for learning harmonic trading | Perfect symmetry is uncommon |
| Supports disciplined risk management | Less reliable in sideways markets |
Treat the AB=CD pattern as a probability-based framework, not a prediction tool. Combining it with market structure and confirmation improves decision-making.
AB=CD Pattern Comparisons
AB=CD vs Gartley Pattern
The AB=CD pattern introduces measured moves with four swing points, while the Gartley expands the idea with five points and more detailed Fibonacci relationships.
AB=CD vs Bat Pattern
Both patterns seek potential reversal zones, but the Bat pattern follows stricter Fibonacci rules and is often used for high-precision reversal setups.
Using the AB=CD Pattern Across Different Markets
Stocks
Price gaps are common, so earnings announcements and corporate news should always be considered alongside technical analysis.
Forex
The pattern appears frequently because of high liquidity. Confirmation from market structure and major support or resistance levels often improves reliability.
Cryptocurrency
Crypto markets trade around the clock and can be highly volatile. Wait for confirmation and avoid increasing position size simply because the pattern looks attractive.
Commodities and Indices
AB=CD patterns often develop around major economic events. Combining them with trend analysis and volume can improve confidence.
Professional Trading Tips
- Start with higher timeframes before refining entries on lower charts.
- Measure swings using Fibonacci tools instead of estimating visually.
- Look for confluence between the PRZ, support or resistance, and price action.
- Keep a trading journal to review completed AB=CD setups.
- Avoid chasing trades that have already moved away from Point D.
- Focus on consistency rather than trying to capture every market move.
Combine the pattern with indicators, support and resistance, and broader market structure. The best AB=CD opportunities are usually obvious; if you have to force the measurements to fit, wait for a better setup.
Conclusion
The AB=CD pattern is one of the simplest yet most valuable harmonic trading patterns because it teaches traders how to measure market symmetry instead of relying on emotion or guesswork. When combined with Fibonacci ratios, market structure, and confirmation signals, it provides a structured framework for identifying potential reversal zones.
Remember that no technical pattern guarantees success. Consistent results come from patience, disciplined execution, and effective risk management. Use the AB=CD pattern as one part of a complete trading plan, continue reviewing historical charts, and practice in a demo environment before risking real capital.
Educational Disclaimer: This guide is for educational purposes only and should not be considered financial or investment advice.
Continue Learning
Frequently Asked Questions
What is the AB=CD harmonic pattern?
The AB=CD pattern is a harmonic price structure that identifies potential reversal zones using two measured price swings and Fibonacci retracement ratios. It helps traders estimate where momentum may weaken, but it should always be confirmed with price action and sound risk management.
Is the AB=CD pattern bullish or bearish?
It can be both. A bullish AB=CD forms after a decline and may signal buying interest, while a bearish AB=CD develops after an advance and may indicate growing selling pressure.
Which timeframe works best?
The pattern can appear on any timeframe, but many traders prefer the 1-hour, 4-hour, daily, and weekly charts because they often produce cleaner market structure and fewer false signals.
Does the AB=CD pattern work in forex, stocks, and crypto?
Yes. Because it is based on price action, it can be applied across stocks, forex, cryptocurrencies, commodities, and indices. Market context remains essential.
Do I need Fibonacci tools?
Yes. Fibonacci retracement and projection tools help validate the pattern objectively instead of relying on visual estimates.
Should I enter immediately at Point D?
No. Point D is a Potential Reversal Zone (PRZ). Wait for confirmation from candlestick patterns, momentum, volume, or market structure.
What is the biggest mistake beginners make?
The most common mistake is forcing patterns that do not meet Fibonacci or symmetry requirements. Clean setups are usually easier to identify.
Can the AB=CD pattern fail?
Yes. Unexpected news, strong trends, poor confirmation, and weak market conditions can invalidate even well-formed patterns.
How can I improve reliability?
Combine the pattern with support and resistance, trend analysis, volume, and disciplined risk management instead of relying on a single signal.
Is the AB=CD pattern suitable for beginners?
Yes. It is often considered the best starting point for learning harmonic trading because it introduces measured moves and Fibonacci analysis without the complexity of advanced harmonic patterns.